What Is the Solar Wind and How Does It Affect Earth?


What Is the Solar Wind and How Does It Affect Earth?
The solar wind is a continuous flow of charged particles and magnetic fields escaping from the Sun’s outer atmosphere. Earth’s magnetosphere redirects most of this plasma, but changes in its speed, proton density, pressure, and magnetic orientation can transfer energy into near-Earth space, producing auroras, geomagnetic storms, satellite drag, navigation errors, radio disruption, and currents in electrical infrastructure.
Key Takeaways
- The solar wind is electrically charged plasma, not atmospheric wind.
- Earth is immersed in the solar wind continuously, including when no major solar eruption is occurring.
- Speed matters, but proton density, magnetic-field strength, Bz orientation, and duration also determine the likely effects.
- Sustained southward Bz generally allows solar-wind energy to enter Earth’s magnetosphere more efficiently.
- People at Earth’s surface are well protected, while satellites, navigation services, radio systems, and power networks can be more sensitive.
This article explains where the solar wind comes from, how it reaches Earth, what happens when it encounters the magnetosphere, and how to read common solar-wind measurements without relying on one dramatic number.
What Is the Solar Wind Made Of?
The solar wind is plasma flowing outward from the Sun. Plasma is a gas-like state in which atoms have separated into positively and negatively charged particles.
The flow consists mainly of protons and electrons, with smaller amounts of alpha particles and heavier ions. Because these particles are electrically charged, the solar wind carries part of the Sun’s magnetic field through the solar system.
That transported field is called the interplanetary magnetic field, usually abbreviated as IMF.
The solar wind originates in the Sun’s outer atmosphere, called the corona. The corona is hot enough that some particles escape the Sun’s gravity and continue outward, helping form the vast region known as the heliosphere.
The NOAA Space Weather Prediction Center’s solar-wind overview explains how this continuous flow varies in speed, density, temperature, and magnetic structure near Earth.
How Fast Does the Solar Wind Travel?
Solar-wind speed near Earth commonly falls within a representative range of roughly 300 to 800 kilometers per second. These are broad observational categories rather than rigid boundaries.
| Solar-wind condition | Representative speed near Earth | Typical characteristics |
|---|---|---|
| Slow solar wind | About 300–500 km/s | Often variable in density and magnetic orientation |
| Fast solar wind | About 500–800 km/s | Commonly associated with coronal holes and may persist for several days |
| Stream interaction region | Variable, usually increasing | Compressed plasma and stronger magnetic fields where fast wind catches slow wind |
| CME-driven disturbance | Highly variable | May contain a shock, compressed plasma, and a rotating magnetic structure |
A stream interaction region, or SIR, forms when faster solar wind catches slower plasma ahead of it. The interaction compresses the plasma and magnetic field between the two streams.
A corotating interaction region, or CIR, is an SIR that persists and returns as the Sun rotates. A long-lived coronal hole can therefore produce similar disturbances during more than one solar rotation.
“Compressed region” is useful as an ordinary description, but SIR and CIR are the more precise technical terms.
How Long Does the Solar Wind Take to Reach Earth?
A simple travel-time estimate divides the average Sun–Earth distance by the average solar-wind speed:
[t=\frac{d}{v}]
In this equation:
- (t) is travel time;
- (d) is distance;
- (v) is average speed.
Using an approximate Sun–Earth distance of 149.6 million kilometers provides a useful scale estimate.
Example: Solar Wind Traveling at 400 km/s
[t=\frac{149{,}600{,}000\ \text{km}}{400\ \text{km/s}}]
[t=374{,}000\ \text{s}\approx4.3\ \text{days}]
Example: Fast Solar Wind Traveling at 800 km/s
[t=\frac{149{,}600{,}000\ \text{km}}{800\ \text{km/s}}]
[t=187{,}000\ \text{s}\approx2.2\ \text{days}]
These are educational estimates, not event-arrival forecasts. Solar-wind streams accelerate closer to the Sun, interact with surrounding plasma, and do not always travel along a perfectly direct Sun–Earth path.
The calculation still shows the correct scale: solar-wind plasma generally takes days to cross the distance between the Sun and Earth.
Electromagnetic radiation from a solar flare is different. Light takes about eight minutes and twenty seconds to travel from the Sun to Earth, commonly rounded to about eight minutes.
How Is the Solar Wind Different From a Solar Flare or CME?
The solar wind, solar flares, coronal mass ejections, and solar energetic particles are related parts of space weather, but they are not interchangeable.
| Phenomenon | What it is | Typical timing at Earth | Main possible effects |
|---|---|---|---|
| Solar wind | Continuous plasma flow carrying magnetic fields | Usually several days from the Sun | Auroras, geomagnetic activity, magnetospheric compression |
| Coronal mass ejection | A large eruption of magnetized solar plasma | Commonly one to several days if Earth-directed | Geomagnetic storms, satellite drag, GPS disruption, grid effects |
| Solar flare | A sudden release of electromagnetic radiation | About eight minutes | Radio blackouts on Earth’s sunlit side |
| Solar energetic particles | High-energy particles accelerated during some eruptions | Tens of minutes to hours in some events | Radiation concerns for spacecraft, astronauts, and polar aviation |
The ordinary solar wind is always present. A coronal mass ejection, or CME, is a distinct large-scale disturbance moving through that background flow.
A solar flare should not be described as a cloud of plasma traveling toward Earth. Its earliest terrestrial effects result from electromagnetic radiation traveling at the speed of light.
The NOAA overview of space-weather impacts distinguishes flare-driven radio blackouts, particle-driven radiation storms, and geomagnetic storms caused by disturbances in the solar wind.
How Does the Solar Wind Interact With Earth?
Earth’s global magnetic field creates a protective region called the magnetosphere. The magnetosphere redirects most incoming solar-wind plasma around the planet, but it is neither rigid nor completely sealed.
Solar-wind pressure compresses the Sun-facing side. On the night side, Earth’s magnetic field is stretched into a long magnetotail.
The NASA explanation of Earth’s magnetosphere describes how this magnetic environment protects Earth while continually changing in response to the solar wind.
A Simplified Text Map of the Sun–Earth Interaction
The following text map is conceptual and not drawn to scale:
Sun → Solar wind → L1 monitor → Bow shock → Magnetosheath → Magnetopause → Magnetotail
Near Earth, part of the transferred energy is directed into magnetospheric currents, the ionosphere, and the polar auroral regions.
The major regions have different roles:
- L1 monitoring region: Upstream spacecraft measure the solar wind before it reaches Earth.
- Bow shock: The supersonic flow slows, heats, and becomes more turbulent.
- Magnetosheath: Compressed solar-wind plasma moves between the bow shock and magnetopause.
- Magnetopause: Solar-wind pressure and Earth’s magnetic pressure reach a changing balance.
- Magnetotail: Magnetic-field lines are stretched behind Earth, away from the Sun.
- Auroral regions: Magnetospheric processes accelerate particles toward the upper atmosphere near the magnetic poles.
The ESA anatomy of Earth’s magnetosphere provides an official visual explanation of these regions.
What Happens Step by Step?
The solar wind approaches Earth.
It carries plasma, kinetic energy, and the interplanetary magnetic field.The flow crosses the bow shock.
The solar wind slows and becomes compressed and turbulent.The disturbed plasma enters the magnetosheath.
Conditions there differ from the undisturbed solar wind measured farther upstream.Pressure acts on the magnetopause.
Higher dynamic pressure can push the dayside magnetopause closer to Earth.Magnetic reconnection may transfer energy.
Under favorable magnetic conditions, solar and terrestrial magnetic fields reconnect.The magnetosphere stores and redistributes energy.
Currents, the magnetotail, radiation belts, and ionosphere respond.Auroras and geomagnetic disturbances may develop.
Particles are accelerated toward the upper atmosphere while magnetic and electrical conditions change across near-Earth space.
Earth’s magnetosphere therefore behaves more like a responsive magnetic shield than a fixed wall.
Which Solar-Wind Measurements Matter Most?
The likely effect of the solar wind cannot be determined from one number. A useful interpretation combines speed, proton density, magnetic-field strength, magnetic orientation, and duration.
The Four-Factor Solar-Wind Impact Framework
| Factor | What it measures | How to interpret it |
|---|---|---|
| Speed | How quickly the plasma is moving | Higher speed can increase available energy, but does not guarantee a storm |
| Proton density | Number of protons per unit volume | Higher density can increase pressure and magnetospheric compression |
| Bt | Total interplanetary magnetic-field strength | Stronger Bt means a stronger magnetic field is available for coupling |
| Bz | North–south magnetic orientation | Sustained southward Bz usually favors more efficient energy transfer |
A practical interpretation asks four questions:
- Is the solar wind fast or accelerating?
- Is the proton density elevated or strongly compressed?
- Is the interplanetary magnetic field strong?
- Has Bz remained southward long enough to matter?
The NOAA explanation of geomagnetic storms identifies sustained southward magnetic fields as a central condition for efficient solar-wind energy transfer into Earth’s magnetosphere.
Why Is Southward Bz Important?
Bz is the north–south component of the interplanetary magnetic field in a coordinate system commonly used for space-weather monitoring.
A positive Bz value generally represents a northward magnetic orientation. A negative Bz value represents a southward orientation.
When Bz remains southward, the interplanetary magnetic field is more favorably aligned for magnetic reconnection with Earth’s dayside magnetic field. This can allow more energy to enter the magnetosphere.
Duration matters as much as the lowest value. A brief reading of −10 nanoteslas may have less effect than a moderately negative Bz that persists for several hours.
Bz should also be interpreted with Bt. A weak magnetic field with negative Bz may provide less coupling potential than a stronger field with the same orientation.
Why Do Proton Density and Dynamic Pressure Matter?
Proton density helps determine how strongly the solar wind presses against Earth’s magnetosphere.
A simplified proton-only estimate of solar-wind dynamic pressure is:
[P_{\text{dyn}}\approx n m_p v^2]
When proton number density is measured in protons per cubic centimeter and speed is measured in kilometers per second, dynamic pressure can be estimated in nanopascals as:
[P_{\text{dyn}}\approx1.67\times10^{-6}nv^2]
In this approximation:
- (n) is proton number density in (\text{cm}^{-3});
- (v) is solar-wind speed in (\text{km/s});
- (P_{\text{dyn}}) is dynamic pressure in nanopascals;
- (m_p) is the proton mass.
Example: Lower-Pressure Solar Wind
For (n=5\ \text{cm}^{-3}) and (v=400\ \text{km/s}):
[P_{\text{dyn}}\approx1.67\times10^{-6}\times5\times400^2]
[P_{\text{dyn}}\approx1.34\ \text{nPa}]
Example: Compressed Fast Flow
For (n=10\ \text{cm}^{-3}) and (v=700\ \text{km/s}):
[P_{\text{dyn}}\approx1.67\times10^{-6}\times10\times700^2]
[P_{\text{dyn}}\approx8.18\ \text{nPa}]
The second flow has about six times the dynamic pressure of the first. Its proton density is only twice as high, but dynamic pressure also depends on the square of speed.
This proton-only calculation is intended to compare approximate pressure scales. Operational calculations may include alpha-particle contributions, instrument uncertainty, flow direction, and additional plasma parameters.
It should not be used for spacecraft operations, infrastructure decisions, or predictions of a particular event.
Does Faster Solar Wind Always Produce a Stronger Geomagnetic Storm?
No. Faster solar wind increases the amount of energy potentially available, but speed alone cannot determine storm strength.
A fast stream with weak magnetic fields or mainly northward Bz may produce less activity than a slower disturbance containing a strong, sustained southward magnetic field.
The more useful question is:
Is the solar wind fast, compressed, strongly magnetized, southward-oriented, and persistent?
A significant response becomes more likely when several of those conditions occur together.
A Practical Solar-Wind Decision Tree
1. Is solar-wind speed elevated or increasing?
- No: Continue monitoring if a strong magnetic structure is expected.
- Yes: Check proton density and magnetic-field data.
2. Has proton density or dynamic pressure increased sharply?
- No: Strong dayside compression may be limited.
- Yes: A shock, SIR, or compressed leading region may be arriving.
3. Is Bt elevated?
- No: The magnetic field available for coupling may be weak.
- Yes: Examine Bz.
4. Has Bz remained southward?
- No: Energy transfer may remain intermittent.
- Yes: Geomagnetic activity is more likely to intensify.
5. Is Earth showing a measurable response?
Check:
- Kp and related geomagnetic indices;
- NOAA watches, warnings, and alerts;
- auroral-oval forecasts;
- regional magnetometers;
- ionospheric products;
- satellite-environment observations.
This decision tree is an interpretation aid, not a replacement for an official forecast.
How Does the Solar Wind Help Produce Auroras?
Auroras develop when energy transferred from the solar wind is stored and redistributed within Earth’s magnetosphere.
That process accelerates charged particles along magnetic-field lines toward the upper atmosphere. Collisions with oxygen and nitrogen transfer energy to atmospheric atoms and molecules. As those gases release the energy, they emit visible light.
The particles producing an aurora are not always simply solar-wind particles traveling directly into the atmosphere. The magnetosphere stores, redirects, and accelerates particles through a more complicated chain of processes.
Stronger geomagnetic activity can expand the auroral oval farther from the magnetic poles. Actual visibility still depends on:
- darkness;
- geographic and magnetic latitude;
- cloud cover;
- horizon visibility;
- local light pollution;
- whether activity occurs during the observer’s available viewing period.
High-speed streams from coronal holes can produce auroras without an Earth-directed CME, particularly when the embedded magnetic field repeatedly turns southward.
How Can the Solar Wind Affect Satellites?
Solar-wind disturbances can affect satellites through several connected mechanisms. The operational risk depends on altitude, spacecraft design, shielding, electronics, orientation, and mission procedures.
Increased Atmospheric Drag
Geomagnetic activity heats Earth’s upper atmosphere and causes it to expand. Low-Earth-orbit satellites then encounter greater atmospheric density.
Possible consequences include:
- faster-than-expected altitude loss;
- increased need for orbit-maintenance maneuvers;
- reduced accuracy in orbital predictions;
- changes in close-approach assessments;
- altered reentry timing for satellites and debris.
NASA research on satellite orbital drag during magnetic storms describes how thermospheric heating can increase neutral density and orbital drag, with effects that vary by altitude and storm intensity.
Electrical and Operational Effects
Spacecraft may also experience:
- surface or internal electrical charging;
- sensor noise;
- temporary computer errors;
- degraded communications;
- unexpected safe-mode events;
- changes in radiation-belt exposure;
- accelerated degradation of some components.
These effects should not all be attributed to ordinary background solar wind. Solar energetic particles, disturbed magnetospheric plasma, and radiation-belt changes can create separate hazards during a broader space-weather event.
A more accurate statement is that solar-wind disturbances can change the near-Earth environment in ways that affect spacecraft.
How Can the Solar Wind Affect GPS and Radio Communication?
Solar-wind plasma does not normally interfere with a ground-based GPS receiver by striking it directly.
Instead, geomagnetic activity changes the ionosphere, the electrically charged region of the upper atmosphere through which satellite radio signals travel.
Irregular ionospheric electron density can affect a signal’s:
- propagation path;
- travel time;
- phase;
- strength;
- stability.
Depending on location, receiver design, frequency, and disturbance intensity, the result may be reduced positioning accuracy or temporary signal loss.
High-frequency radio communication is also sensitive to ionospheric conditions. Geomagnetic disturbances can alter long-distance propagation routes, particularly in polar and high-latitude regions.
A solar flare can create a rapid radio blackout on Earth’s sunlit side through intense X-ray and ultraviolet radiation. A solar-wind-driven geomagnetic storm affects communications through a different mechanism and generally develops over a longer period.
How Can the Solar Wind Affect Power Grids and Pipelines?
Rapid changes in Earth’s magnetic field can induce electric fields in the ground. Those geoelectric fields may drive currents through long conductive systems.
Affected systems can include:
- high-voltage transmission lines;
- transformers;
- long-distance pipelines;
- rail or signaling infrastructure;
- other grounded conductive networks.
Possible grid effects include unusual transformer currents, voltage-control difficulties, protective-system activation, heating, and increased operational stress.
Risk depends on more than the strength of the space-weather event. Important factors include:
- regional geology;
- ground conductivity;
- transmission-line orientation;
- transformer design;
- network configuration;
- operating conditions;
- the rate at which the magnetic field changes.
The USGS review of magnetic storms and geoelectric hazards explains why geoelectric effects vary with both geomagnetic disturbance and local geological conductivity.
Two regions exposed to the same magnetic storm may therefore experience different induced electric fields.
Is the Solar Wind Dangerous to People on Earth?
For people at Earth’s surface, ordinary changes in solar-wind conditions do not require personal protective action.
Earth’s magnetosphere redirects much of the plasma, while the atmosphere provides an additional protective barrier.
Operational concerns are primarily associated with satellites, communications, navigation, power systems, astronauts, and some high-altitude or polar activities.
The distinction among related phenomena is important:
- the background solar wind is a continuous plasma flow;
- a CME is a large magnetized disturbance;
- solar energetic particles can create more immediate radiation concerns;
- magnetospheric and radiation-belt changes can affect spacecraft after energy reaches Earth.
These processes should not be compressed into the misleading statement that ordinary solar wind directly harms people on the ground.
What Does a Coronal-Hole High-Speed Stream Look Like in Practice?
Consider an illustrative scenario in which a large coronal hole rotates into a position that can send fast solar wind toward Earth.
Stage 1: Forecast Models Identify a Possible Arrival
Solar imagery and numerical models suggest that a high-speed stream may reach Earth in several days.
The estimated arrival time remains uncertain because the coronal hole’s shape, source longitude, magnetic connection, and interaction with slower wind cannot be known perfectly.
Stage 2: A Stream Interaction Region Arrives
Fast plasma begins catching slower solar wind ahead of it. Plasma and magnetic fields become compressed.
Near-Earth instruments may observe:
- higher proton density;
- rising dynamic pressure;
- stronger Bt;
- variable Bz;
- an eventual increase in speed.
Stage 3: Geomagnetic Activity Begins
The strongest response may occur in the compressed leading region, particularly if Bz turns southward.
Auroral activity and geomagnetic indices can increase before the highest solar-wind speed is measured.
Stage 4: Fast Solar Wind Continues
Speed may remain elevated for several days after the leading compression passes.
Geomagnetic activity can rise and fall because Bz may alternate between northward and southward orientations.
Stage 5: The Pattern May Return
The Sun rotates relative to Earth in roughly 27 days. If the coronal hole remains stable, a similar stream may return during the next rotation.
The next disturbance will not necessarily have the same timing or intensity because coronal holes and surrounding solar-wind conditions evolve.
This scenario highlights an easily missed limitation: maximum solar-wind speed and maximum geomagnetic activity do not always occur at the same time.
How Should You Read Real-Time Solar-Wind Data?
A reliable interpretation begins with data quality, not the largest number on the chart.
Practical monitoring rule: Confirm the UTC timestamp, update time, instrument status, and visible data gaps before interpreting the measurements. A delayed or frozen chart can look scientifically meaningful while no longer representing current conditions.
The NOAA real-time solar-wind dashboard provides operational measurements and data-status information.
Step 1: Confirm Time and Data Status
Check:
- whether the display uses UTC;
- the time of the latest reading;
- whether the chart is still updating;
- whether gaps or warnings are visible;
- which spacecraft or instrument supplied the data.
Do not interpret a line that has stopped updating as a stable physical condition.
Step 2: Examine the Speed Trend
Determine whether speed is stable, rising gradually, increasing sharply, remaining elevated, or declining.
A trend provides more context than one isolated reading.
Step 3: Check Proton Density and Pressure
A sudden proton-density increase may indicate a shock or compressed interaction region.
High density combined with high speed can produce a sharp rise in dynamic pressure.
Step 4: Check Bt
Bt represents total magnetic-field strength.
A higher Bt means a stronger field is available, but Bt does not show whether the orientation is favorable for energy transfer.
Step 5: Check Bz Over Time
Look for sustained southward Bz rather than reacting to one brief negative spike.
Repeated southward intervals may also drive activity when they continue over a meaningful period.
Step 6: Check Earth’s Response
Solar-wind measurements describe the incoming driver. Geomagnetic indices and auroral products describe parts of Earth’s response.
Compare the upstream data with:
- Kp;
- official geomagnetic alerts;
- auroral-oval forecasts;
- magnetometer readings;
- ionospheric products;
- satellite-environment observations.
Step 7: Apply Local Conditions
For aurora viewing, also check:
- cloud cover;
- twilight and darkness;
- moonlight;
- latitude;
- horizon visibility;
- light pollution;
- the difference between UTC and local time.
Favorable solar-wind conditions cannot overcome daylight or a completely overcast sky.
How Much Warning Can an L1 Monitor Provide?
Operational solar-wind measurements are commonly collected upstream of Earth near the Sun–Earth L1 region.
L1 is approximately 1.5 million kilometers sunward of Earth. Plasma measured there still needs time to reach the magnetosphere.
At (400\ \text{km/s}):
[t=\frac{1{,}500{,}000\ \text{km}}{400\ \text{km/s}}]
[t\approx62.5\ \text{minutes}]
At (800\ \text{km/s}):
[t=\frac{1{,}500{,}000\ \text{km}}{800\ \text{km/s}}]
[t\approx31.3\ \text{minutes}]
Actual operational lead time can differ because:
- the monitoring spacecraft is not fixed at one exact distance;
- the plasma may not move directly along the Sun–Earth line;
- solar-wind structures can be tilted or irregular;
- different parts of a disturbance may travel at different speeds;
- measurements and propagation models require processing.
L1 data provide valuable short-term confirmation, but they do not create a perfectly precise countdown.
The spacecraft or instrument supplying a real-time feed can also change. Readers should check the current provider and data-status notice instead of relying on an older mission name.
Why Did the Expected Aurora or Geomagnetic Storm Not Happen?
Space-weather forecasts describe probabilities and expected conditions, not guaranteed outcomes.
The Disturbance Arrived Earlier or Later
Solar-wind structures change during transit. Their speed, shape, and interaction with surrounding plasma can shift the arrival time.
Bz Turned Northward
A fast, dense disturbance may reach Earth but transfer less energy than expected if its magnetic field remains northward.
Southward Bz Did Not Last Long Enough
A brief negative Bz interval may produce a limited response. Sustained orientation is generally more important than one instantaneous minimum.
The Magnetic Field Was Weak
Negative Bz may be present, but weak Bt can limit the magnetic energy available for coupling.
The Forecast Described Broad Geomagnetic Conditions
Kp summarizes planetary geomagnetic activity over a three-hour interval. It does not guarantee identical auroral visibility at every location.
Local Viewing Conditions Were Poor
Clouds, haze, twilight, moonlight, terrain, trees, or urban lighting can hide a genuine aurora.
The Data Were Delayed or Incomplete
Real-time measurements can contain data gaps, processing delays, calibration changes, or temporary instrument problems.
A forecast that appears to have failed may instead reflect timing uncertainty, unfavorable magnetic orientation, weak coupling, or unsuitable local conditions.
What Are the Most Common Solar-Wind Interpretation Mistakes?
Treating Speed as the Entire Forecast
Speed is only one part of the system. Proton density, Bt, Bz, duration, and Earth’s measured response also matter.
Calling Every Disturbance a CME
Coronal-hole streams, SIRs, and CIRs can produce geomagnetic activity without a recent Earth-directed CME.
Confusing a Solar Flare With the Solar Wind
A solar flare is primarily an electromagnetic-radiation event. The solar wind is a continuous flow of plasma and embedded magnetic fields.
Reacting to One Bz Reading
A single negative value does not show how long the condition lasted or whether the total magnetic field was strong.
Treating an Arrival Forecast as an Exact Schedule
Models estimate when a disturbance may arrive, but its internal magnetic structure often remains uncertain until it is measured closer to Earth.
Using Space-Weather Data as a Local Sky Forecast
Solar-wind measurements indicate geomagnetic potential. They do not describe local clouds, darkness, or horizon visibility.
Assuming Every Technology Responds in the Same Way
Radio blackouts, radiation storms, GPS errors, satellite drag, and power-grid effects arise through different physical mechanisms.
What Should Different Readers Do Next?
| Reader | Most useful information | Practical next step |
|---|---|---|
| Aurora observer | Bz, Bt, speed, Kp, auroral oval, cloud cover | Combine official space-weather data with darkness and local sky conditions |
| Amateur radio operator | Geomagnetic indices, ionospheric products, flare alerts | Monitor propagation conditions and prepare alternative bands or routes |
| Satellite operator | Proton density, pressure, geomagnetic forecasts, atmospheric-density models | Follow mission-specific procedures for orbit, charging, and communications |
| GPS-dependent professional | Geomagnetic alerts and ionospheric conditions | Use validated backup methods when positioning accuracy is operationally important |
| Power-system operator | Geomagnetic warnings and regional geoelectric models | Follow organization-specific procedures and official alerts |
| General reader | NOAA alerts and plain-language forecasts | Use complete official summaries rather than isolated screenshots |
What This Article Does Not Claim
This article does not:
- predict a particular solar storm;
- guarantee aurora visibility;
- estimate damage to a specific satellite, pipeline, or power grid;
- replace official space-weather alerts;
- provide operational instructions for spacecraft or critical infrastructure;
- connect one solar-wind measurement to a specific ground-level weather event.
The solar wind is one part of a connected system involving the Sun, interplanetary space, Earth’s magnetosphere, the ionosphere, the upper atmosphere, technological infrastructure, and local observing conditions.
What Is the Practical Conclusion?
The solar wind is a permanent feature of the space environment, not an occasional blast that appears only during dramatic solar eruptions.
Earth’s magnetosphere redirects most incoming plasma, but variations in speed, proton density, dynamic pressure, magnetic-field strength, and Bz orientation can transfer substantial energy into near-Earth space.
For general awareness, use official NOAA summaries instead of reacting to one isolated measurement.
Aurora observers should combine solar-wind conditions with Kp, auroral-oval forecasts, darkness, and cloud cover.
Satellite, navigation, radio, and power-system professionals should rely on products and operating procedures designed for their particular systems.
The most useful rule is simple:
Do not judge the likely effect of the solar wind from speed alone. Examine the complete pattern, how long it lasts, and how Earth actually responds.
Frequently Asked Questions
Is the Solar Wind Always Blowing?
Yes. The Sun continuously releases plasma and magnetic fields into the solar system.
Its speed, density, temperature, composition, and magnetic orientation change over time. CMEs and other disturbances travel through this background flow rather than replacing it.
Can the Solar Wind Cause Auroras Without a CME?
Yes. High-speed streams from coronal holes can drive geomagnetic activity, especially when compressed plasma arrives and Bz remains southward.
A persistent coronal hole may produce recurring activity during later solar rotations, although the strength and timing can change.
How Long Does the Solar Wind Take to Reach Earth?
A simplified estimate is approximately two to six days for speeds within the broad range of about 300 to 800 km/s.
Actual structures can arrive earlier or later because their speed changes and they interact with surrounding solar-wind streams.
Does Negative Bz Guarantee a Geomagnetic Storm?
No. Southward Bz favors magnetic reconnection, but the outcome also depends on Bt, speed, proton density, dynamic pressure, duration, and existing magnetospheric conditions.
Can the Solar Wind Affect Ordinary Weather?
The solar wind drives space weather, which affects the magnetosphere, ionosphere, upper atmosphere, and technological systems.
It is not atmospheric wind and does not directly create local rain, thunderstorms, heat waves, or cold fronts.
Where Can I Check Current Solar-Wind Conditions?
The NOAA Space Weather Prediction Center provides operational observations, forecasts, watches, warnings, and alerts.
When reading a real-time chart, confirm the UTC timestamp, latest update, data provider, and any instrument warnings before interpreting the measurements.
Sources
Accessed August 3, 2026.
NOAA Space Weather Prediction Center — Solar Wind
Background on solar-wind composition, representative speeds, coronal-hole streams, SIRs, and CIRs.NOAA Space Weather Prediction Center — Geomagnetic Storms
Explanation of solar-wind energy transfer, southward magnetic fields, Kp, auroras, satellite drag, and geomagnetically induced currents.NOAA Space Weather Prediction Center — Space Weather Impacts
Overview of effects on radio, navigation, satellites, aviation, and power systems.NOAA Space Weather Prediction Center — Real-Time Solar Wind
Operational solar-wind measurements, timestamps, and data-status information.NASA Science — Earth’s Magnetosphere: Protecting Our Planet From Harmful Space Energy
Background on Earth’s magnetic field and its interaction with solar particles and energy.NASA Technical Reports Server — Satellite Orbital Drag During Magnetic Storms
Research on thermospheric heating, neutral density, orbital drag, and altitude-dependent satellite effects.ESA — Anatomy of Earth’s Magnetosphere
Definitions and visual context for the bow shock, magnetosheath, magnetopause, magnetotail, auroras, and magnetic reconnection.ESA — The Solar Wind
Overview of solar-wind particles, the heliosphere, Earth’s magnetic protection, and technological effects.U.S. Geological Survey — Geomagnetism Program
Information about monitoring Earth’s magnetic field and assessing geomagnetic hazards.U.S. Geological Survey — Magnetic Storms and Geoelectric Hazards
Research on induced geoelectric fields, geological conductivity, and grounded infrastructure.
Editorial Basis and Review
This article includes original explanatory frameworks, worked calculations, a decision tree, and practical interpretation steps based on published first-party sources.
The content distinguishes among:
- established physical principles;
- simplified numerical estimates;
- practical interpretation guidance;
- operational recommendations;
- known forecasting limitations.
The travel-time and dynamic-pressure examples state their assumptions and units. They explain physical scale rather than predict a particular event or support critical operational decisions.
Before publication, the article was editorially checked against the cited NOAA, NASA, ESA, and USGS materials for terminology, calculation consistency, source alignment, and clear separation of facts, estimates, and practical guidance.
No private measurements, unpublished experiments, fabricated experts, invented user experiences, or claims of independent scientific research were used.
More from Solar Storms & Space Weather
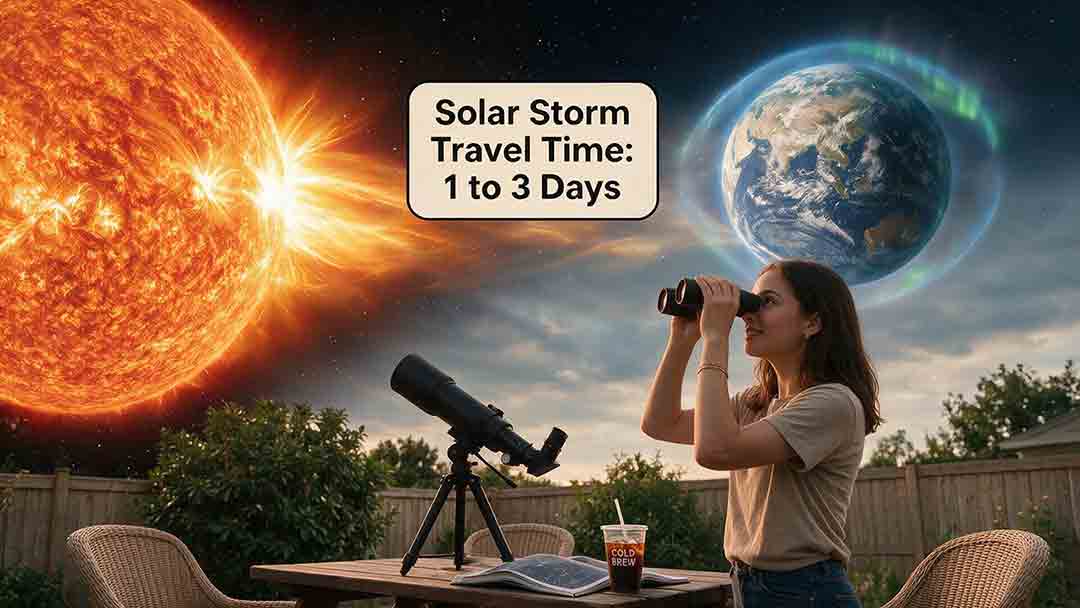
How Long Does a Solar Storm Take to Reach Earth?
A solar storm does not reach Earth on a single timetable because its radiation, energetic particles, and plasma travel at very different speeds. Solar-flare radiation arrives in about 8 minutes 20 seconds, while the fastest solar energetic particles can arrive in tens of minutes or less. An Earth-directed coronal mass ejection, or CME, generally takes one to several days, although exceptional events may arrive in roughly 15–18 hours. This guide introduces the Three-Clock, Two-Window Method for separating these timelines and understanding the difference between an early model forecast and short-term confirmation from spacecraft near the Sun–Earth L1 region. It also provides a transparent constant-speed calculation, real-world CME examples, common timing mistakes, and a practical process for interpreting official space-weather reports. Readers will learn why CME speed alone cannot determine arrival time, geomagnetic-storm strength, or whether aurora will be visible from a specific location.
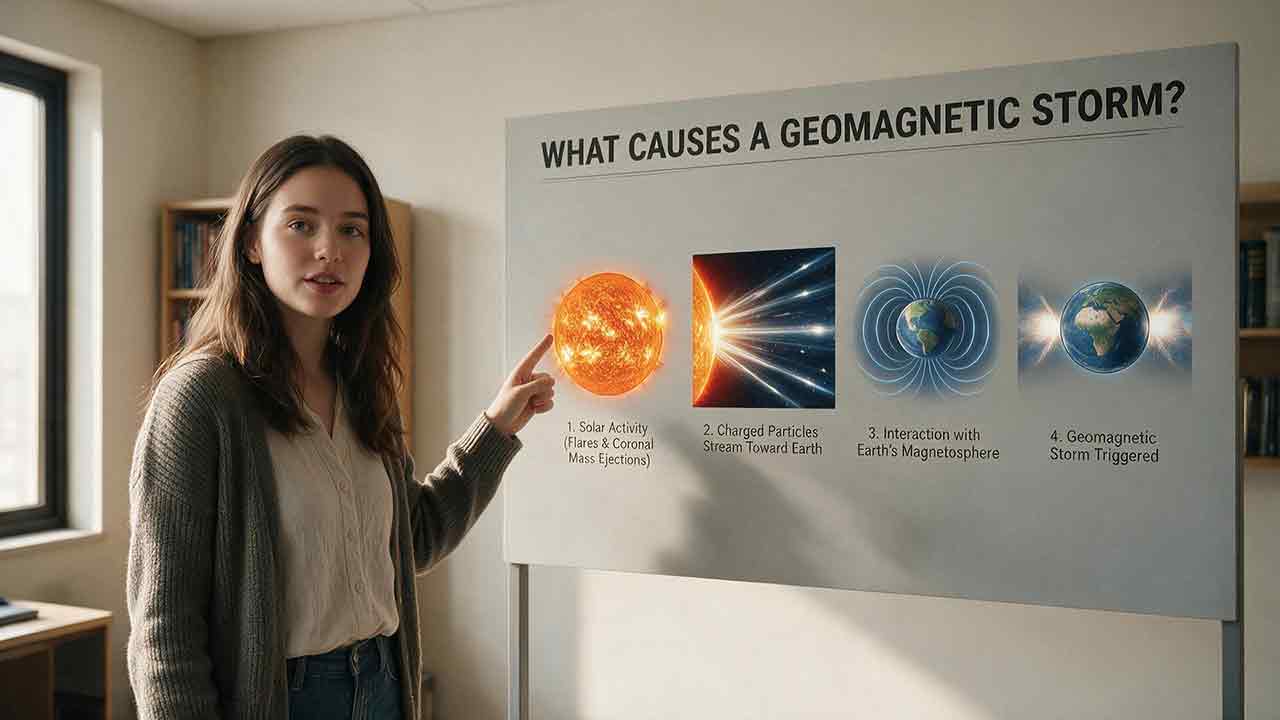
What Causes a Geomagnetic Storm?
A geomagnetic storm develops when a magnetized disturbance in the solar wind reaches Earth and transfers substantial energy into the magnetosphere. This guide explains the two main source pathways: Earth-directed coronal mass ejections, including their shocks and sheath regions, and high-speed solar-wind streams produced by coronal holes and co-rotating interaction regions. It shows why sustained southward Bz is often more important than solar-wind speed or flare class alone, and how magnetic reconnection intensifies currents and particle activity around Earth. The article also introduces a practical Four-Question Storm Potential Test, a transparent coupling calculation, a storm-potential matrix, and a forecast-reading checklist. Readers will learn how Kp, Dst, and local magnetic changes describe different parts of a storm, why forecasts remain uncertain, and how geomagnetic activity may affect auroras, satellites, navigation, radio communication, atmospheric drag, and grounded long-conductor systems.

Solar Flare vs Coronal Mass Ejection: What Is the Difference?
A solar flare and a coronal mass ejection are related solar events, but they are not the same phenomenon. A solar flare is a rapid burst of electromagnetic radiation that can affect Earth’s sunlit ionosphere within about eight minutes, sometimes disrupting high-frequency radio communication. A coronal mass ejection, or CME, is a large cloud of magnetized plasma that usually takes many hours or several days to reach Earth. If it is Earth-directed and carries favorable magnetic conditions, a CME may trigger a geomagnetic storm, expand auroral visibility, increase satellite drag, and affect navigation or power systems. This guide compares their composition, speed, arrival time, NOAA alert scales, and potential effects. It also introduces the Flash–Cloud–Compass framework, practical checklists, travel-time examples, and troubleshooting guidance to help readers interpret flare reports, CME forecasts, Bz measurements, Kp values, and aurora alerts without confusing one type of space-weather event with another.
Explore More Topics

How to Photograph the Northern Lights
Photographing the Northern Lights requires more than choosing one fixed camera setting. This practical guide explains how to select a camera and lens, focus accurately on stars, stabilize your equipment, and adjust shutter speed, aperture, and ISO according to the aurora’s brightness and movement. It includes starting settings for fast, moderate, and faint displays, along with a Motion–Brightness–Foreground framework that helps photographers make better decisions as conditions change. Readers will also learn how to use a smartphone Night mode, compose a stronger foreground, protect color-channel highlights, edit images responsibly, and disclose exposure blends clearly. A quick-reference card, three-frame comparison method, packing checklist, safety guidance, and detailed troubleshooting table make the article useful in the field. The guide relies on published guidance from NASA, NOAA, Nikon, Canon, and Apple while clearly distinguishing authoritative information from adjustable photography recommendations.

How Far South Can the Northern Lights Be Seen?
The northern lights usually remain within high-latitude regions, but powerful geomagnetic storms can carry visible aurora surprisingly far south. This guide explains why there is no single worldwide southern boundary and shows how geomagnetic latitude, the auroral oval, Kp, storm intensity, emission altitude, darkness, cloud cover, and local light pollution affect what an observer may see. It examines NOAA’s generalized U.S. visibility examples for G1 through G5 storms, while clarifying that locations such as Alabama, Florida, and southern Texas represent rare historical possibilities rather than guaranteed forecast limits. Readers will also find an original four-gate decision framework, an auditable geometric viewing-distance example, regional viewing guidance, a practical checklist, and troubleshooting advice for distinguishing faint aurora from clouds or artificial sky glow. The article helps observers decide when a forecast justifies going outside or traveling to a safer, darker viewing site.

What Are the Best Conditions for Seeing the Northern Lights?
The best Northern Lights viewing conditions occur when geomagnetic activity, clear weather, darkness, and a suitable observing location align. This guide explains why the position of the auroral oval matters more than relying on a single Kp value and shows how cloud cover, twilight, light pollution, moonlight, atmospheric transparency, and horizon visibility affect what an observer can see. It introduces the Five-Gate Aurora Viewing Framework, a practical planning tool that evaluates aurora activity, clouds, darkness, location, and available viewing time without presenting the result as a guaranteed probability. Readers will also learn how to compare short- and long-range forecasts, convert UTC forecast periods, choose a safe dark-sky site, recognize faint aurora, and troubleshoot a promising forecast that produces no visible display. The article is based on guidance from NOAA, NASA, the University of Alaska Fairbanks, and the National Park Service.