Forecast Tools & Alerts
Explore 5 fascinating articles about forecast tools & alerts
Monitor real-time space weather conditions. Understand geomagnetic storm watches, solar flare warnings, and alert systems.
All Articles (5)
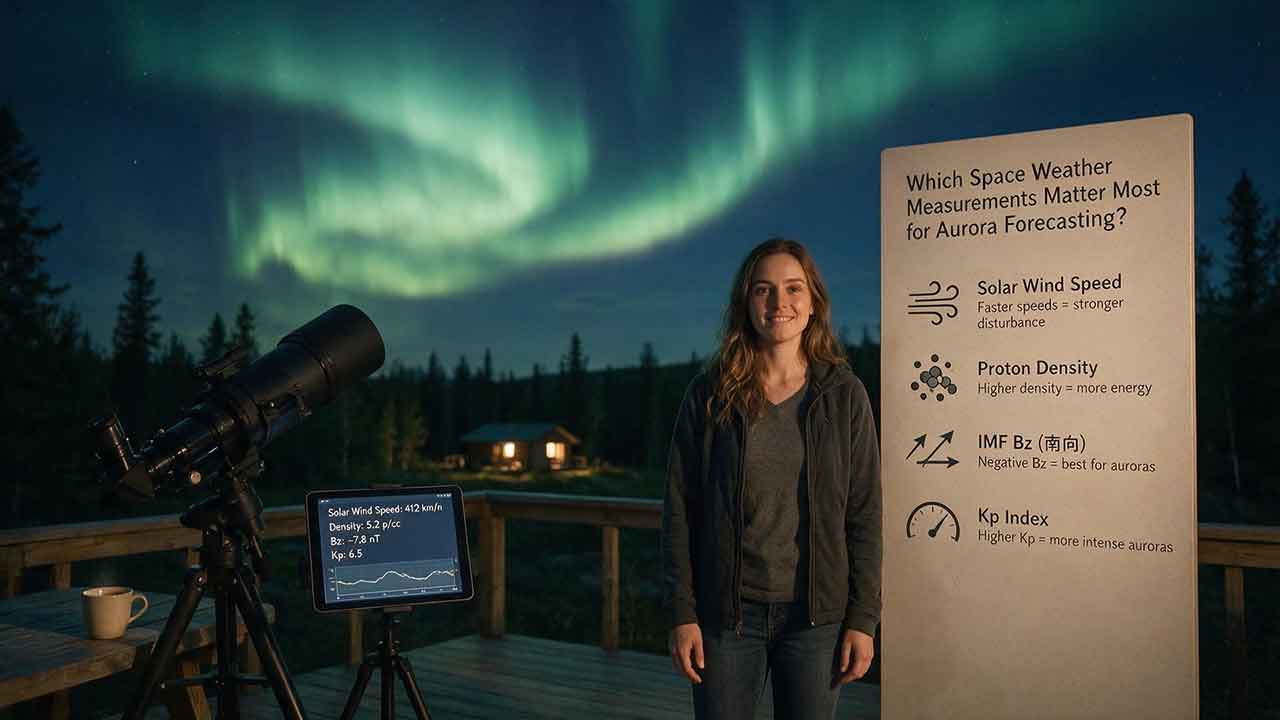
Which Space Weather Measurements Matter Most for Aurora Forecasting?
Aurora forecasting becomes more reliable when each space weather measurement is used for the right decision window. This guide explains why CME direction and propagation models matter several days ahead, while sustained southward Bz, total magnetic-field strength, solar-wind speed, density, and dynamic pressure become more useful as a disturbance approaches Earth. It also shows how Kp, auroral-oval maps, hemispheric power, AE, Dst, and local magnetometers answer different forecasting questions. Readers will learn a practical Signal–Coupling–Response–Visibility framework, compare upstream warning time with NOAA’s auroral-model guidance, work through a dynamic-pressure example, and troubleshoot conflicting forecast signals. The article also explains commonly overvalued indicators, including flare class, isolated Bz spikes, and Kp values without local-time context. Designed for aurora viewers, photographers, and travelers, it provides a clear checklist for combining official space weather data with darkness, cloud cover, road safety, and horizon visibility—without promising that any single measurement can guarantee a visible display.
How Reliable Are Aurora Forecast Apps?
Aurora forecast apps are useful for identifying periods of elevated geomagnetic activity, but they cannot guarantee that the northern lights will be visible from a specific location at a specific time. This guide explains why app alerts sometimes disagree, how forecast reliability changes as an event approaches, and which measurements deserve the most attention. Readers will learn how to interpret the auroral oval, observed and forecast Kp, solar-wind speed, Bz, cloud cover, darkness, timestamps, and official space-weather alerts. The article also introduces the Signal-to-Sky Reliability Framework, a viewing-location comparison tool, and a transparent method for auditing app notifications without inventing accuracy claims. Practical tables, troubleshooting guidance, and a step-by-step verification process help casual observers, photographers, travelers, and lower-latitude aurora chasers decide when an alert is worth acting on. The guide is based on authoritative documentation and published research rather than hands-on commercial app rankings.
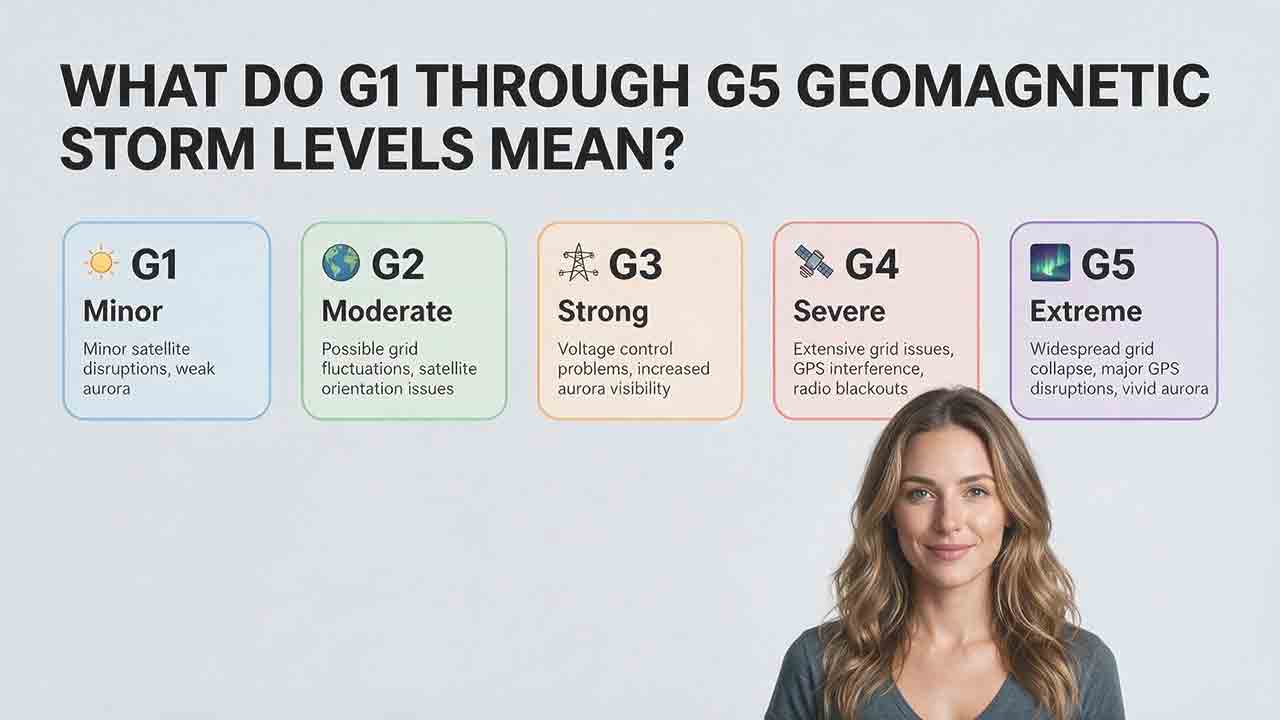
What Do G1 Through G5 Geomagnetic Storm Levels Mean?
NOAA’s G1 through G5 scale ranks geomagnetic storms from minor to extreme and translates planetary Kp measurements into practical impact categories. This guide explains the exact relationship between G levels and Kp notation, including why Kp 9− remains G4 while only Kp 9o qualifies as G5. It compares the possible effects of each level on aurora visibility, power systems, satellites, high-frequency radio, GPS, and precision navigation without treating those outcomes as guaranteed. Readers also learn how to distinguish a forecast, watch, warning, and observed alert; convert UTC forecast windows; interpret decimal Kp values such as 4.67 and 8.67; and apply the Scale–Status–Window–Location–System framework. Practical tables, a G3 watch example, common mistakes, and user-specific recommendations help the public, aurora observers, and technical users respond appropriately without unnecessary alarm.
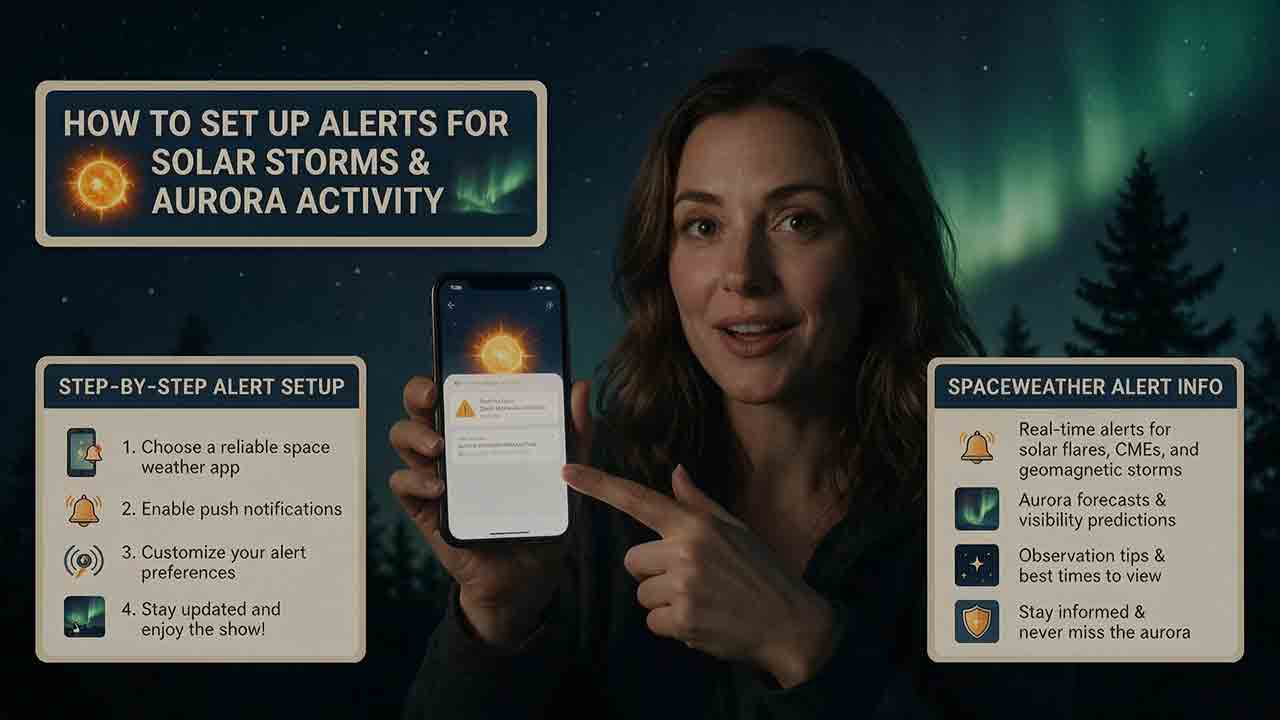
How to Set Up Alerts for Solar Storms and Aurora Activity
This practical guide explains how to build a reliable alert system for solar storms and aurora activity using official NOAA space-weather messages, location-aware aurora tools, and local weather forecasts. It clarifies the differences between forecasts, watches, warnings, and observed-threshold alerts, then shows readers how to select useful geomagnetic products, choose location-appropriate Kp thresholds, convert emails into phone notifications, and verify alerts with current auroral oval, darkness, and cloud information. The article also introduces the Three-Layer Alert Stack, Four-Gate Go-or-No-Go Check, and Two-Trigger Rule to help readers avoid acting on a single notification. Separate recommendations are included for casual observers, photographers, travelers, Southern Hemisphere viewers, amateur radio operators, and technical users. Troubleshooting steps, a notification-delivery audit, custom-alert guidance, common mistakes, and a pre-departure safety checklist make the guide useful for both initial setup and ongoing maintenance.
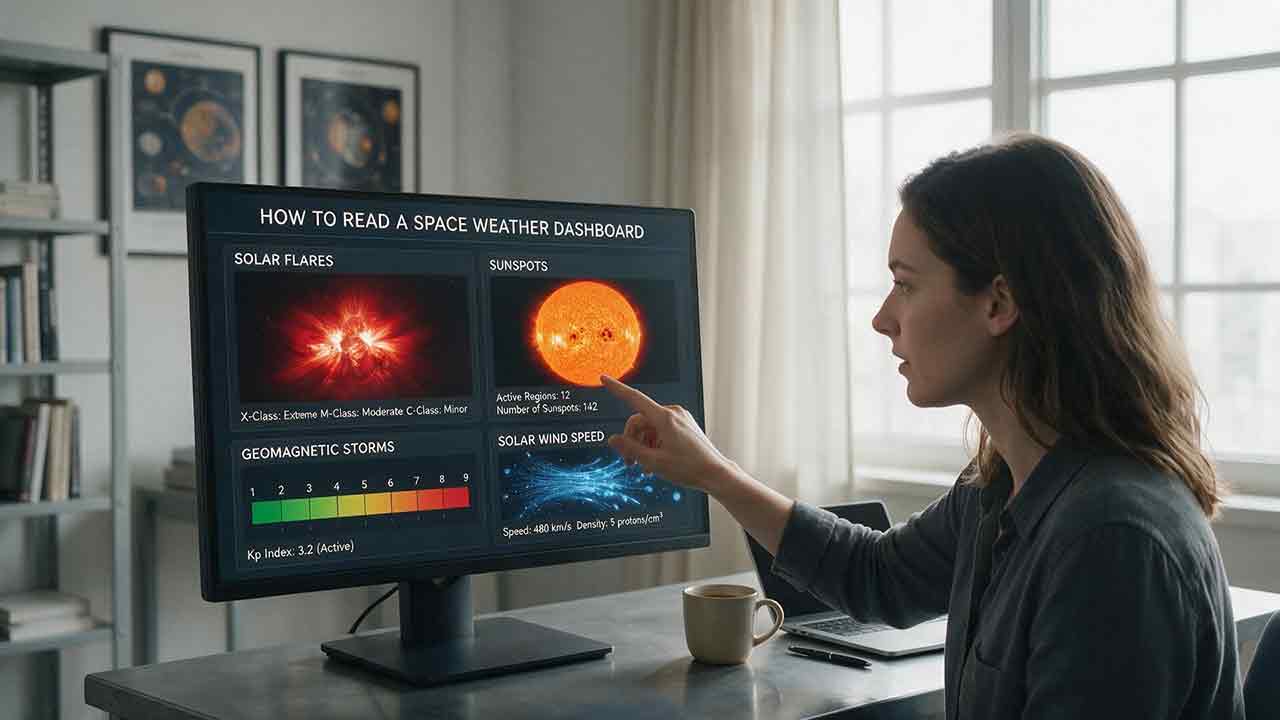
How to Read a Space Weather Dashboard
This practical guide explains how to read a space weather dashboard without relying on a single dramatic number. It shows readers how to distinguish NOAA’s G, S, and R scales, separate observations from forecasts and alerts, and interpret Kp, solar-wind speed, density, Bt, Bz, X-ray flux, proton flux, and auroral forecasts. The article introduces clear editorial frameworks for matching each indicator to a specific goal, including aurora viewing, HF radio monitoring, GNSS awareness, satellite operations, and power-grid context. It also includes a simplified L1-to-Earth travel-time calculation, a hypothetical dashboard example, troubleshooting advice, common interpretation mistakes, and a five-minute checklist. Based on authoritative NOAA, NASA, National Weather Service, and USGS documentation, the guide emphasizes uncertainty, timestamps, source status, and professional-use limitations while helping ordinary readers turn a complex dashboard into a reliable decision-support tool.