How to Read a Space Weather Dashboard

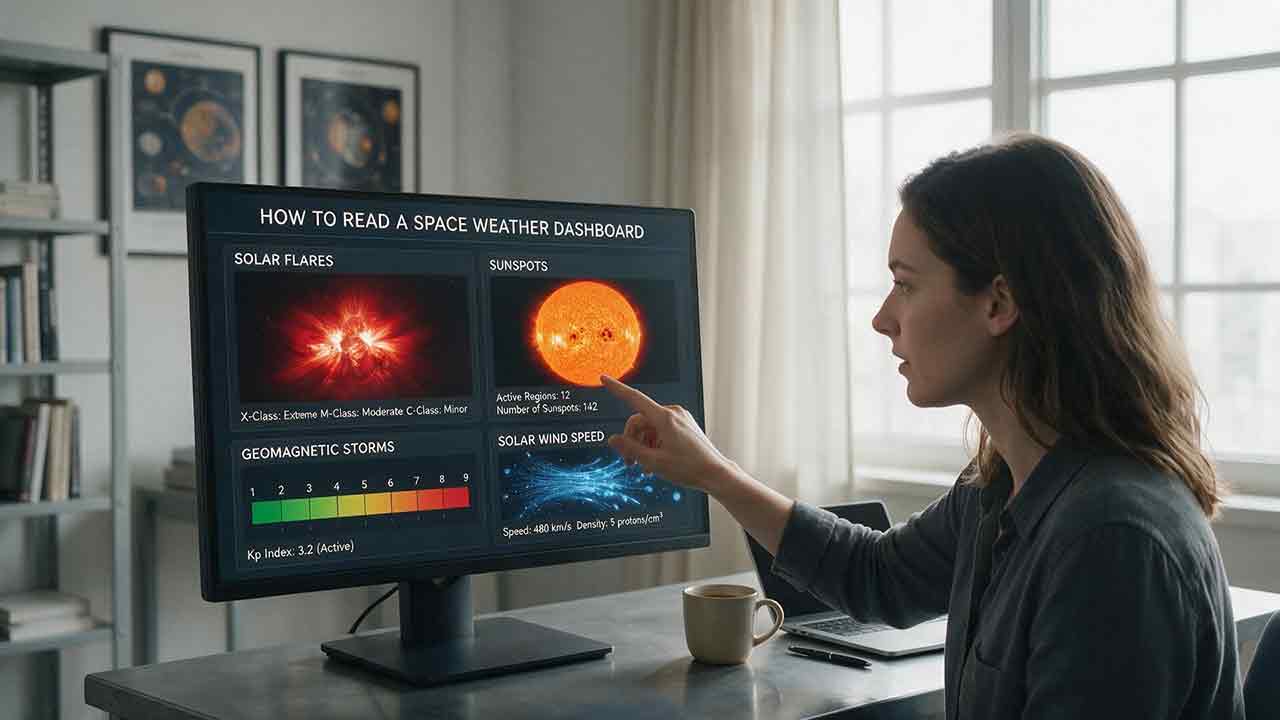
How to Read a Space Weather Dashboard
To read a space weather dashboard, first identify the NOAA G, S, and R status, then check whether each item is an observation, forecast, watch, warning, or alert. After that, read only the measurements tied to your goal—Kp and solar wind for geomagnetic activity, X-rays for radio blackouts, proton flux for radiation storms, and the auroral oval for short-term aurora planning.
Key Takeaways
- Start with your question, not with the most dramatic-looking number on the screen.
- G, S, and R describe three different types of space weather effects.
- Separate past observations from current conditions and future forecasts.
- Read solar-wind speed, density, Bt, and Bz as a connected pattern rather than isolated values.
- Confirm an interpretation with at least one additional indicator before acting on it.
A space weather dashboard combines several monitoring systems that operate on different timescales. This guide shows how to turn those charts into a practical reading sequence for aurora viewing, radio communication, GNSS awareness, satellite monitoring, power-grid context, or general interest.
The core reading order: Goal → Impact scale → Time status → Physical driver → Confirming signal → Local decision
The named methods in this article are editorial reading tools developed for this guide. They are not official NOAA classifications or operational procedures.
Quick Navigation
- How to read the dashboard in 60 seconds
- What the G, S, and R scales mean
- How to separate observations from forecasts
- How to read solar-wind measurements
- How to read Kp
- How to read X-ray and proton charts
- Which indicators matter for your goal
- How to troubleshoot confusing data
- Five-minute checklist
- Frequently asked questions
Who Is This Guide For?
This guide is useful for:
- Aurora observers
- Amateur-radio operators
- GPS and GNSS users
- Pilots and aviation enthusiasts
- Satellite and spaceflight followers
- Educators and students
- Readers trying to understand NOAA space weather alerts
It is designed for interpretation and situational awareness. It does not replace an aviation dispatch system, satellite operator procedure, radiation assessment, power-grid operating plan, navigation integrity service, or emergency-management instruction.
Professional users should follow their organization’s approved products, thresholds, and response procedures.
How Can You Read a Space Weather Dashboard in 60 Seconds?
Before reading any number, decide what question you are trying to answer.
Are you checking:
- Whether an aurora trip is worthwhile?
- Whether HF radio conditions may be disrupted?
- Whether energetic particles are elevated?
- Whether geomagnetic activity may affect GNSS?
- Whether a satellite environment is becoming more disturbed?
- Whether an official warning or threshold has been issued?
Once the goal is clear, use the following four-pass reading method.
Pass 1: Check the G, S, and R status
Find the current and forecast NOAA scales:
- G: Geomagnetic storms
- S: Solar radiation storms
- R: Radio blackouts
These scales answer the first practical question: What kind of space weather effect is being reported?
Do not treat G, S, and R as three stages of one storm. They represent different physical events and can rise or remain quiet independently.
Pass 2: Identify the time status
Determine whether each value describes:
- A past maximum
- The latest observation
- A forecast
- A watch
- A warning
- An alert
A G2 maximum during the previous 24 hours does not mean G2 conditions are still occurring. A forecast probability does not mean an event has already started.
Pass 3: Open the relevant driver chart
Match the impact to the measurement that helps explain it:
| Your question | Start with |
|---|---|
| Geomagnetic storm or aurora activity | Kp, solar-wind speed, Bt, Bz, density |
| Flare-related HF radio disruption | GOES X-ray flux and R scale |
| Solar radiation storm | GOES proton flux and S scale |
| Short-term aurora location | Aurora oval, solar wind, Kp, darkness, clouds |
| Power-grid context | G scale, magnetometer data, geoelectric products |
| Satellite environment | G and S scales plus mission-specific telemetry |
Pass 4: Look for confirmation
Do not make a decision from one spike or one panel.
A brief negative Bz reading becomes more meaningful when:
- Bt is elevated;
- solar-wind speed or density has changed;
- southward Bz persists;
- Kp or ground magnetometers begin responding;
- the auroral oval expands.
This confirmation step helps distinguish a developing event from ordinary short-term variation or questionable data.
What Do the G, S, and R Scales Mean?
The NOAA Space Weather Scales translate three different environmental disturbances into five severity levels.
| Scale | Event type | Primary physical measure | Commonly relevant systems |
|---|---|---|---|
| G1–G5 | Geomagnetic storm | Planetary Kp and related geomagnetic observations | Aurora, satellites, GNSS, HF radio, power systems |
| S1–S5 | Solar radiation storm | Proton flux at energies of at least 10 MeV | Spacecraft, astronauts, polar aviation, polar HF radio |
| R1–R5 | Radio blackout | GOES soft X-ray flux from solar flares | HF radio and some navigation services on Earth’s sunlit side |
The scales communicate likely categories of impact. They do not calculate the exact effect on a particular receiver, aircraft, satellite, grid region, or observer.
How should you read the G scale?
The G scale describes disturbance in Earth’s magnetic environment.
NOAA begins G1 conditions at Kp 5. Higher levels correspond to stronger planetary geomagnetic disturbance:
| NOAA level | Official Kp relationship |
|---|---|
| Below G1 | Kp below 5 |
| G1 | Kp 5 |
| G2 | Kp 6 |
| G3 | Kp 7 |
| G4 | Kp 8 and the lower part of Kp 9 |
| G5 | The highest Kp 9 category |
NOAA displays the detailed notation on its Planetary K-index product. The current official scale label should take priority over an informal summary or a third-party app’s wording.
Geomagnetic storms may be associated with wider auroral visibility, ionospheric disturbance, satellite effects, changes in atmospheric drag, induced currents, and degraded radio or navigation performance.
The real effect depends on location, storm duration, system design, local magnetic conditions, and—in the case of ground systems—regional geology.
How should you read the S scale?
The S scale describes elevated energetic proton conditions near Earth.
The NOAA GOES Proton Flux product uses proton measurements at several energy thresholds. The S scale is based on protons with energies of at least 10 MeV.
S1 begins when the measured or expected flux reaches 10 proton flux units, or pfu. Higher S levels correspond to thresholds of 100, 1,000, 10,000, and 100,000 pfu.
Solar radiation storms can matter to:
- Spacecraft electronics
- Crewed spaceflight
- Polar aviation
- Polar HF communication
- Radiation-environment monitoring
An S-scale event is not a geomagnetic storm. Proton flux can be elevated while Kp remains low.
How should you read the R scale?
The R scale describes radio blackouts caused by enhanced solar X-rays from a flare.
The effects mainly occur on the sunlit side of Earth because that is where flare radiation increases ionization in the upper atmosphere.
The official scale begins at:
| Flare level | NOAA radio-blackout level |
|---|---|
| M1 | R1 |
| M5 | R2 |
| X1 | R3 |
| X10 | R4 |
| X20 | R5 |
The full thresholds and impact descriptions are listed in the NOAA Space Weather Scales.
An R event does not prove that an Earth-directed coronal mass ejection has occurred. A flare can produce an immediate radio effect without causing a later geomagnetic storm.
How Do Observations, Forecasts, Watches, Warnings, and Alerts Differ?
These labels answer different timing questions.
| Label | Practical reading |
|---|---|
| Observed maximum | The strongest level reached during a stated past period |
| Latest observed | The most recently assessed condition |
| Forecast | Conditions or probabilities expected during a future period |
| Watch | Risk has increased, but occurrence or timing remains uncertain |
| Warning | An event is occurring, imminent, or considered likely with relatively high confidence |
| Alert | A defined observational threshold has been crossed or an event has begun |
| Summary | A report describing an event after or near its completion |
The descriptions above are a reading aid. Individual NOAA Space Weather Prediction Center products have more precise issuance thresholds, lead times, and cancellation rules.
According to the National Weather Service explanation of space weather watches, warnings, and alerts:
- Geomagnetic watches may provide one to three days of advance notice.
- Warnings are shorter-term, higher-confidence products.
- Alerts confirm that an observational threshold has been reached.
- Not every scale level uses the same watch, warning, and alert process.
For example, the R scale begins at R1, but NOAA’s public alert structure does not necessarily issue an identical alert product for every R1 event.
Why does this distinction matter?
Suppose a dashboard shows:
- A 24-hour observed maximum of G2
- A latest observed value below storm level
- A forecast chance of G1 tomorrow
Those are three separate statements:
- G2 occurred at some point during the previous reporting period.
- Current conditions are now below G1.
- A new G1 interval may occur during a future period.
Reading only the largest number would produce the wrong conclusion.
Which Dashboard Panels Matter Most?
A general dashboard may display many panels at once, but each one answers a different question.
| Panel | What it tells you | What it cannot tell you alone |
|---|---|---|
| G, S, and R scales | Communicated severity of three impact categories | Exact local effects |
| Three-day forecast | Expected conditions and probabilities by UTC date | Minute-by-minute timing |
| Forecast discussion | Why forecasters expect particular conditions | A guaranteed outcome |
| Alerts and warnings | Official threshold or near-term operational messages | Every local or system-specific consequence |
| GOES X-ray flux | Current solar flare activity | Whether a CME is Earth-directed |
| GOES proton flux | Energetic proton conditions near Earth | General geomagnetic storm strength |
| Solar-wind speed | How rapidly upstream plasma is moving | Whether magnetic coupling will be efficient |
| Solar-wind density | Plasma concentration and possible compression signatures | Magnetic orientation |
| Bt | Total interplanetary magnetic-field strength | Whether the field points north or south |
| Bz | North-south magnetic-field component | Event strength without duration and context |
| Planetary Kp | Recent global geomagnetic disturbance | Exact local aurora visibility |
| Aurora oval | Modeled short-term auroral location and intensity | Cloud cover, darkness, or guaranteed visibility |
| Ground magnetometers | Regional magnetic-field changes | A complete impact assessment for every system |
The NOAA Space Weather Prediction Center dashboard provides a general overview. Its individual product pages explain how each chart is calculated and how it should be used.
How Do You Read Solar-Wind Speed, Density, Bt, and Bz?
The solar wind is a flow of plasma and embedded magnetic field moving outward from the Sun.
Near-Earth forecasting systems use observations from spacecraft positioned upstream of Earth, commonly near the L1 region. Those observations offer a limited preview of plasma and magnetic-field conditions approaching Earth.
Open the current NOAA Solar Wind Observations page rather than relying on an old screenshot or assuming that the same spacecraft always supplies the data.
What does solar-wind speed mean?
Solar-wind speed is usually displayed in kilometers per second.
Higher speed can increase the potential for geomagnetic activity, but speed alone does not determine storm strength. A fast stream with a weak or mostly northward magnetic field may produce less disturbance than a slower structure containing a stronger, sustained southward field.
The NOAA explanation of the solar wind emphasizes that space weather effects depend on speed, density, and the direction of the embedded magnetic field.
What does density mean?
Density estimates how many solar-wind particles occupy a given volume.
A sharp increase may indicate:
- A compressed region
- A shock
- A stream interface
- The leading portion of an arriving disturbance
Density can contribute to magnetospheric compression, but a density spike does not reveal the complete magnetic structure behind it.
Treat density as a possible arrival clue, not as a stand-alone storm forecast.
What does Bt mean?
Bt represents the total strength of the interplanetary magnetic field.
A larger Bt means that a stronger magnetic field is present. However, Bt does not reveal whether the field orientation is favorable for transferring substantial energy into Earth’s magnetic environment.
Bt answers: How much magnetic field is available?
Bz helps answer: How is part of that field oriented?
What does Bz mean?
Bz is the north-south component of the interplanetary magnetic field.
On common space weather displays:
- Positive Bz generally represents a northward orientation.
- Negative Bz generally represents a southward orientation.
- Sustained southward Bz usually favors more efficient coupling with Earth’s magnetic field.
The word sustained matters.
A one-minute dip below zero may be a short fluctuation, a small structure, or questionable data. A longer period of southward Bz is more meaningful when Bt is elevated and the solar wind is moving rapidly enough to deliver substantial energy.
How should speed, density, Bt, and Bz be combined?
Use the Strength–Direction–Duration Check:
- Strength: Is Bt elevated relative to the recent background?
- Direction: Is Bz mainly southward?
- Duration: Has the pattern lasted, or is it one brief spike?
- Pressure: Did speed or density increase?
- Response: Are Kp, magnetometers, or the auroral oval reacting?
This method does not produce a guaranteed storm level. It prevents a common mistake: treating one Bz number as if it were a complete forecast.
Why should you check the active data source?
Operational spacecraft, instruments, and dashboard interfaces can change.
For example, a NOAA update published on June 30, 2026 documented a change in the operational solar-wind feed and retirement of an older display.
That change is useful as a general lesson: do not memorize one spacecraft name as a permanent source. Check the current:
- Source label
- Update time
- Status message
- Instrument selection
- Data-quality notice
A chart that is visible but no longer updating should not be interpreted as current conditions.
How Do You Read the Kp Index?
Kp is a planetary index used to summarize geomagnetic disturbance on a scale extending from quiet conditions to Kp 9.
The NOAA Planetary K-index is an estimated three-hour index derived from a network of ground magnetometers. NOAA’s chart can refresh frequently, but the index still represents geomagnetic activity over a three-hour interval.
What does a Kp value mean?
| Kp value | Practical interpretation |
|---|---|
| 0–1 | Very quiet to quiet geomagnetic conditions |
| 2–3 | Quiet to unsettled conditions |
| 4 | Active or disturbed, but below G1 |
| 5 | G1 |
| 6 | G2 |
| 7 | G3 |
| 8 | G4 |
| Highest Kp 9 category | G5 |
The current official NOAA label should take priority because estimated values may include intermediate notation and provisional readings.
Why can Kp appear to react slowly?
Solar-wind measurements are taken upstream of Earth and may change minute by minute. Kp summarizes Earth’s measured geomagnetic response over a broader interval.
This creates a natural sequence:
- An upstream solar-wind structure is measured.
- The structure travels toward Earth.
- Earth’s magnetosphere responds.
- Ground magnetometers record the disturbance.
- The estimated Kp reflects that response.
Kp therefore confirms broad geomagnetic activity rather than serving as a minute-by-minute measurement of the arriving solar wind.
Why is Kp not a local aurora guarantee?
Kp is a planetary indicator. It does not measure:
- Cloud cover
- Daylight
- Light pollution
- Your local magnetic latitude
- Obstructions near the horizon
- Short-lived auroral substorms
- The sensitivity of your eyes or camera
- The exact position of the auroral oval over your location
Use Kp to understand the overall disturbance level, then check the auroral oval and local observing conditions.
How Do You Read the GOES X-Ray Flux Chart?
The NOAA GOES X-ray Flux chart tracks solar X-ray emissions and is used to identify solar flares.
The familiar flare classes are:
- A
- B
- C
- M
- X
Each letter represents a tenfold step in peak X-ray flux. The number shows the position within the class, so M5 is stronger than M1 and X2 is stronger than X1.
What should you look for?
Read the chart in this order:
- Check the update timestamp.
- Look for a rapid rise above the recent background.
- Identify the flare class at the peak.
- Check whether an R-scale threshold was reached.
- Determine which part of Earth was sunlit at that time.
- Read any related NOAA alert or event summary.
Large X-ray increases can rapidly change the sunlit ionosphere and disrupt HF radio propagation.
Does the X-ray chart provide advance warning?
Usually not in the way a weather radar might warn of an approaching storm.
Solar X-rays travel at the speed of light. According to NASA’s space weather explanation, flare radiation reaches Earth roughly eight minutes after leaving the Sun.
Near-Earth GOES instruments receive the X-rays at approximately the same time that the radiation begins affecting Earth’s sunlit upper atmosphere. The chart therefore mainly confirms a flare-driven radio event rather than providing substantial advance warning before that effect begins.
This is different from an upstream solar-wind monitor, which may provide tens of minutes of lead time before measured plasma reaches Earth.
Does a large flare guarantee a geomagnetic storm?
No.
A flare is an intense burst of electromagnetic radiation. A coronal mass ejection, or CME, is a large eruption of plasma and magnetic field.
The two can occur together, but:
- A flare may occur without an Earth-directed CME.
- A CME may travel away from Earth.
- An Earth-directed CME may arrive with a magnetic orientation that produces a weaker-than-expected geomagnetic response.
The X-ray chart does not show the direction or magnetic structure of a CME.
How Do You Read the GOES Proton Flux Chart?
The NOAA GOES Proton Flux chart displays energetic proton measurements at multiple energy thresholds.
For general S-scale interpretation, focus on the line representing protons with energies of at least 10 MeV.
What does pfu mean?
A proton flux unit is:
1 proton per square centimeter per second per steradian
The unit describes particle flux through a defined area and direction.
For the S scale:
| Proton flux at ≥10 MeV | NOAA level |
|---|---|
| 10 pfu | S1 |
| 100 pfu | S2 |
| 1,000 pfu | S3 |
| 10,000 pfu | S4 |
| 100,000 pfu | S5 |
Who should pay attention to this chart?
The proton chart is especially relevant to:
- Spacecraft operators
- Crewed-spaceflight planners
- Radiation-environment researchers
- Polar aviation
- Polar HF radio users
It is usually less useful as a direct aurora-viewing tool.
A high proton flux does not automatically mean that Kp is high, that a CME has arrived, or that visible aurora will occur at lower latitudes.
How Much Warning Time Can Each Signal Provide?
Space weather signals reach Earth on very different timescales.
| Signal or event | Approximate timing | What the dashboard provides |
|---|---|---|
| Solar X-rays from a flare | About eight minutes from Sun to Earth | Near-immediate flare and radio-blackout confirmation |
| Energetic solar particles | From tens of minutes to hours, depending on energy and magnetic connection | Rising proton flux and S-scale thresholds |
| CME-driven solar-wind structure | Commonly one to several days after eruption | Forecast arrival window, followed by upstream observations |
| Solar wind measured near L1 | Often about 30–90 minutes before reaching Earth | Speed, density, Bt, Bz, and short-term model input |
| Kp | Represents geomagnetic response over three-hour intervals | Broad confirmation and storm classification |
These ranges are estimates rather than countdown guarantees.
A CME may accelerate or decelerate during transit. Particle timing depends on energy and magnetic connectivity. L1-to-Earth travel time changes with solar-wind speed, spacecraft position, and propagation assumptions.
How Can You Estimate the L1-to-Earth Travel Time?
A simple estimate divides the approximate remaining distance by the measured solar-wind speed.
Assume:
- Approximate upstream distance: 1,500,000 kilometers
- Solar-wind speed: 500 kilometers per second
Travel time = 1,500,000 km ÷ 500 km/s
Travel time = 3,000 seconds
3,000 seconds ÷ 60 = approximately 50 minutes
For comparison:
| Solar-wind speed | Simplified travel-time estimate |
|---|---|
| 350 km/s | About 71 minutes |
| 500 km/s | About 50 minutes |
| 700 km/s | About 36 minutes |
This is an educational estimate, not a precise arrival prediction.
The NOAA Aurora 30-Minute Forecast describes a broader lead-time range of approximately 30–90 minutes. That range reflects the time required for measured solar wind to travel from the upstream observation region toward Earth.
Which Indicators Matter for Your Goal?
The most useful dashboard panel depends on the decision you are making.
Use this Impact–Driver–Confirmation Framework:
- Impact: Which G, S, or R category applies?
- Driver: Which physical measurement is producing the condition?
- Confirmation: Which independent observation supports the interpretation?
- Local filter: What important factor is missing from the dashboard?
If Your Goal Is to See the Aurora
Start with:
- G-scale forecast or alert
- Kp
- Solar-wind speed
- Bt and Bz
- Aurora oval
- Darkness and cloud cover
A practical sequence is:
- Check whether geomagnetic storm conditions are forecast or active.
- Convert the relevant UTC period into local time.
- Check whether that local time is dark.
- Review the solar wind for a meaningful and sustained pattern.
- Open the short-term auroral oval.
- Check cloud cover, visibility, and light pollution.
- Identify a safe location with an open view toward the expected auroral direction.
The NOAA auroral product is based on the OVATION model and provides a modeled forecast of auroral location and intensity. It does not include local clouds, fog, terrain, daylight, or light pollution.
A bright aurora may sometimes be visible toward the horizon even when the oval is not directly overhead. That possibility is not a guarantee.
If Your Goal Is to Monitor HF Radio
Start with:
- R scale
- GOES X-ray flux
- S scale
- GOES proton flux
- Sunlit-side location
- Polar absorption information, when relevant
A flare-driven R event primarily affects Earth’s sunlit ionosphere. A solar radiation storm can create additional radio absorption at high latitudes.
Check:
- The event time in UTC
- Which side of Earth was sunlit
- Whether the communication path crosses the dayside
- Whether the path passes through polar regions
- Actual band conditions and professional propagation products
The same flare does not affect every frequency, path, and location equally.
If Your Goal Is to Assess GPS or GNSS Conditions
Start with:
- G scale
- Kp
- Current NOAA alerts
- Forecast discussion
- Regional ionospheric or GNSS integrity products
Geomagnetic disturbance can alter the ionosphere through which satellite-navigation signals travel. However, Kp cannot be converted into one universal number of meters of positioning error.
The actual effect depends on:
- Receiver design
- Frequency use
- Satellite geometry
- Latitude
- Local ionospheric conditions
- Correction services
- Required integrity and accuracy
Consumer navigation, precision agriculture, surveying, aviation, timing, and scientific GNSS applications have very different tolerances.
Professional users should rely on application-specific monitoring rather than using Kp as a direct accuracy calculator.
If Your Goal Is to Monitor Satellite Conditions
Start with:
- G scale
- S scale
- Proton flux
- Solar-wind pressure indicators
- Geomagnetic activity
- Mission-specific radiation and charging data
A public dashboard provides environmental context. It cannot determine whether a particular spacecraft is safe.
Risk depends on:
- Orbit
- Shielding
- Electronic components
- Spacecraft orientation
- Operational mode
- Charging susceptibility
- Radiation tolerance
- Atmospheric drag exposure
- Mission procedures
Satellite operators should use mission telemetry, engineering models, radiation monitors, orbit products, and approved response plans.
If Your Goal Is to Understand Power-Grid Risk
Start with:
- G scale
- Official geomagnetic warnings
- Ground magnetometers
- Regional geoelectric-field products
- Utility-specific operating information
Geomagnetic storms can generate electric fields in the ground and induce currents in long conductors.
The effect is geographically uneven. The USGS Geomagnetism Program explains that regional magnetic disturbance and the electrical conductivity of the ground both influence geoelectric hazards.
A 2026 USGS review of magnetic storms and geoelectric hazards likewise emphasizes that local surface impedance and geomagnetic variation differ substantially across regions.
Members of the public generally should not disconnect household electronics or take unusual electrical action solely because a minor or moderate G-scale event appears on a dashboard. Grid operators use specialized monitoring, engineering analysis, and operating procedures.
What Does a Real Dashboard Interpretation Look Like?
Hypothetical educational example—not a live forecast and not a universal threshold guide.
Suppose the dashboard shows:
- A chance of G1 conditions in the three-day forecast
- A geomagnetic warning issued later
- Solar-wind speed rising from about 380 to 520 km/s
- Bt increasing to approximately 14 nT
- Bz fluctuating before remaining near −10 nT for 20 minutes
- A brief density increase
- Estimated Kp still near 4
- The auroral oval beginning to expand
What can reasonably be concluded?
The earlier forecast established that geomagnetic activity was possible. The warning indicates greater confidence that relevant conditions are imminent or expected.
The changes in speed, density, and Bt suggest that a new solar-wind structure may have arrived at the upstream monitor. Sustained negative Bz creates a more favorable orientation for energy transfer into Earth’s magnetic environment.
Kp may not rise immediately because it represents Earth’s response rather than the upstream cause. Expansion of the auroral oval provides an additional, though still modeled, confirmation signal.
What should an aurora observer do next?
The observer should:
- Convert the valid UTC period to local time.
- Confirm that the location will be dark.
- Check clouds, fog, smoke, and visibility.
- Choose a safe dark site with a clear horizon.
- Continue monitoring the oval and solar-wind trend.
- Avoid treating the example values as fixed viewing thresholds.
The example demonstrates a reasoning process. It does not claim that Bt 14 nT, Bz −10 nT, or 520 km/s guarantees a storm level or visible aurora.
Which Is Better: A General Dashboard or a Specialized Product?
Neither is universally better.
| Tool | Advantages | Limitations |
|---|---|---|
| General dashboard | Fast overview of multiple hazards | Crowded and not locally specific |
| Three-day forecast | Useful for planning | Timing and intensity remain uncertain |
| Forecast discussion | Explains forecaster reasoning | Requires more reading and interpretation |
| Real-time solar-wind chart | Shows arrival signatures and magnetic structure | Short lead time and possible data gaps |
| Kp chart | Simple global geomagnetic summary | Broad, time-averaged, and not local |
| Aurora oval | Useful short-term visual guide | Excludes clouds, darkness, and light pollution |
| Specialized aviation, GNSS, grid, or satellite product | Better matched to a professional decision | May require training or restricted access |
A sensible workflow is to begin with the general dashboard and move to a specialized product when the decision requires greater precision.
What Common Mistakes Lead to Wrong Conclusions?
Treating G, S, and R as interchangeable
A radio blackout, radiation storm, and geomagnetic storm are different events. Always read the letter before reacting to the number.
Confusing a past maximum with current conditions
The largest value on the page may describe an event that has ended. Check the latest observation and timestamp.
Treating one negative Bz reading as a forecast
Bz can change rapidly. Examine duration, Bt, speed, density, and Earth’s geomagnetic response.
Assuming every large flare will produce a geomagnetic storm
A flare can cause an R-scale event without an Earth-directed CME. Even an Earth-directed CME may arrive with a less effective magnetic orientation.
Assuming high Kp guarantees local aurora
Aurora visibility also depends on darkness, clouds, light pollution, magnetic latitude, oval position, event timing, and viewing direction.
Ignoring UTC
NOAA operational products generally use Coordinated Universal Time. A UTC date can correspond to the previous afternoon or evening in North America and a later date in Asia or Oceania.
Convert both the date and time.
Trusting a stale chart
A chart may remain visible after its data stream stops updating. Always check the last update time and current source label.
Treating a third-party score as an official NOAA scale
An app may simplify official data into a proprietary score. That score is not automatically equivalent to G, S, R, Kp, or an official warning product.
Reacting to exact numbers without considering context
Space weather is a connected system. A number becomes useful only when its source, timing, trend, and relationship to other measurements are understood.
How Do You Troubleshoot Confusing Dashboard Data?
Why is a chart blank or interrupted?
Possible causes include:
- Instrument calibration
- Spacecraft eclipse
- Communication interruption
- Source switching
- Invalid or missing observations
- A browser rendering problem
- Planned product maintenance
The NOAA GOES X-ray Flux documentation notes that data gaps can occur during instrument calibrations and satellite eclipse periods.
Check:
- The chart’s update time
- The active instrument or spacecraft
- Official status messages
- Another related product
- Whether the numerical feed is also missing
A missing line should not automatically be read as zero activity.
Why does the solar wind look strong while Kp remains low?
Possible explanations include:
- The measured structure has not reached Earth.
- Southward Bz did not last long enough.
- Bt was weak despite fast solar wind.
- Earth’s geomagnetic response is still developing.
- The upstream data contain a brief spike.
- The displayed Kp interval has not yet incorporated the response.
Compare timestamps before assuming that the products disagree.
Why is Kp high while the aurora map looks less impressive?
The products may use different update times or inputs.
The strongest geomagnetic interval may have occurred earlier, or the auroral model may be operating without a current upstream input. NOAA notes that when modeled solar-wind input is unavailable, the auroral product may use Kp and lose its normal forecast lead time.
Review the map’s timestamp and animation rather than judging one frame.
Why do the homepage and forecast appear inconsistent?
The homepage may display:
- A 24-hour maximum
- A latest observation
- Several forecast days
- Current probabilities
- Active warning products
The forecast may have been issued at a different time.
Compare:
- Issue time
- Valid time
- Observation versus forecast label
- Event category
- Update frequency
Why do values change dramatically from minute to minute?
Short changes can be genuine, but they may also reflect:
- Small structures within the solar wind
- Instrument uncertainty
- A source transition
- Invalid points
- Display scaling
Zoom out and examine the broader trend. Operational decisions should not be based on an unexplained one-point spike.
What Is the Five-Minute Space Weather Checklist?
Use this checklist each time you open a dashboard:
- What question am I trying to answer?
- Which scale—G, S, or R—applies?
- Am I reading a past observation, current condition, or forecast?
- Is there a watch, warning, alert, or summary?
- What is the issue time?
- What is the valid time?
- Have I converted UTC correctly?
- Is the chart still updating?
- Which physical measurement is driving the condition?
- Does another indicator support the interpretation?
- What local factor is missing from the dashboard?
- Does this decision require a specialized professional product?
What Can a Space Weather Dashboard Do Well?
A well-designed dashboard can:
- Combine several official data streams
- Show changing environmental conditions
- Translate measurements into impact categories
- Support early planning
- Confirm that a threshold has been reached
- Reveal relationships between solar events and Earth’s response
- Help users decide when a specialized product is needed
Its greatest value is not predicting every consequence. Its value is organizing situational awareness.
What Can a Dashboard Not Guarantee?
A public space weather dashboard cannot guarantee:
- Aurora visibility at a specific location
- A specific GNSS positioning error
- Damage to a particular satellite
- A household power interruption
- Failure of every HF radio path
- The exact magnetic structure of a CME days before arrival
- A precise storm start and end time
- The safety of a professional operation
Forecasts and models express the best available scientific assessment under uncertainty. They are not promises.
What Should You Do Next?
A space weather dashboard becomes easier to use when you stop searching for one decisive number.
Begin with the question you want answered. Identify the relevant G, S, or R category, confirm whether the information is observed or predicted, and then inspect the physical driver connected to that category.
For aurora viewing, continue from Kp to the solar wind, auroral oval, darkness, and clouds. For radio conditions, focus on the R and S scales, X-ray flux, proton flux, and geographic exposure. Professional GNSS, aviation, satellite, and power users should continue from the public dashboard to their approved operational systems.
Frequently Asked Questions
Is Kp the most important number on a space weather dashboard?
Kp is important for summarizing global geomagnetic activity, but it is not the most important measurement for every purpose. HF radio users may care more about X-ray and proton conditions, while aurora observers should combine Kp with solar-wind data, the auroral oval, darkness, and local weather.
Does negative Bz always cause a geomagnetic storm?
No. Southward Bz generally favors stronger magnetic coupling, but the outcome also depends on Bt, duration, solar-wind speed, density, the structure of the disturbance, and Earth’s response. A brief negative reading is not a storm guarantee.
Why does the dashboard use UTC?
UTC gives forecasters and users one global time standard. Always convert both the time and date into your local zone, especially when a forecast interval crosses midnight.
Can a dashboard predict the northern lights exactly?
No. A dashboard can estimate auroral activity and location, but visibility also depends on darkness, cloud cover, light pollution, magnetic latitude, viewing direction, terrain, and short-lived changes within the aurora.
What should I do when data stop updating?
Check the timestamp, active data source, instrument status, official alert feed, and another related observation. A flat or missing line may indicate a data interruption rather than quiet conditions.
Are third-party space weather apps reliable?
Some third-party apps present official data clearly, but their alert rules and proprietary scores vary. Check the source of the data, update frequency, time zone, and whether the app distinguishes observations from forecasts. Use NOAA or the relevant national authority for official warnings.
Sources
The following first-party and authoritative sources were reviewed for this guide:
- NOAA Space Weather Prediction Center — operational dashboard, observations, forecasts, alerts, and product navigation.
- NOAA Space Weather Scales — G, S, and R thresholds and impact descriptions.
- NOAA Planetary K-index — Kp calculation, three-hour intervals, G-scale mapping, and operational use.
- NOAA GOES X-ray Flux — flare classes, event detection, radio effects, and data limitations.
- NOAA GOES Proton Flux — proton energy channels, pfu units, S-scale thresholds, and alerts.
- NOAA Solar Wind Observations — upstream magnetic-field, plasma, spacecraft-source, and display information.
- NOAA Solar Wind Overview — solar-wind speed, density, magnetic orientation, and geomagnetic relevance.
- NOAA Aurora 30-Minute Forecast — OVATION model, auroral location and intensity, and 30–90-minute lead-time explanation.
- National Weather Service Space Weather Watches, Warnings, and Alerts — practical definitions and product timing.
- NASA Space Weather and Its Effects on Earth — solar flare, CME, particle, and geomagnetic timing.
- NASA Heliophysics: Space Weather — scientific background and space-weather research.
- USGS Geomagnetism Program — ground magnetic observations and geomagnetic hazard research.
- USGS Magnetic Storms and Geoelectric Hazards — regional geology, geoelectric fields, and power-system context.
Editorial Approach
This guide is based on published specifications, authoritative documentation, and practical interpretation criteria rather than hands-on product testing.
Official NOAA definitions are separated from the editorial reading frameworks created for this article. Numerical scenarios are labeled as estimates or hypothetical examples and should not be treated as universal thresholds.
Operational dashboards, spacecraft sources, instruments, interfaces, and warning products can change. Readers should check the timestamp, current source label, and linked official documentation when interpreting live conditions.
Review Notes
This article was checked against NOAA, National Weather Service, NASA, and USGS reference materials for:
- G, S, and R scale definitions
- Kp and G-scale relationships
- X-ray and proton thresholds
- Observation and forecast terminology
- Solar-wind interpretation
- Aurora-product timing and limitations
- Separation of flares, CMEs, radiation storms, and geomagnetic storms
- Appropriate treatment of uncertainty
- Professional-use boundaries
This article does not predict a specific event, guarantee aurora visibility, assess the safety of an individual flight or spacecraft, or replace professional operational guidance.
More from Forecast Tools & Alerts
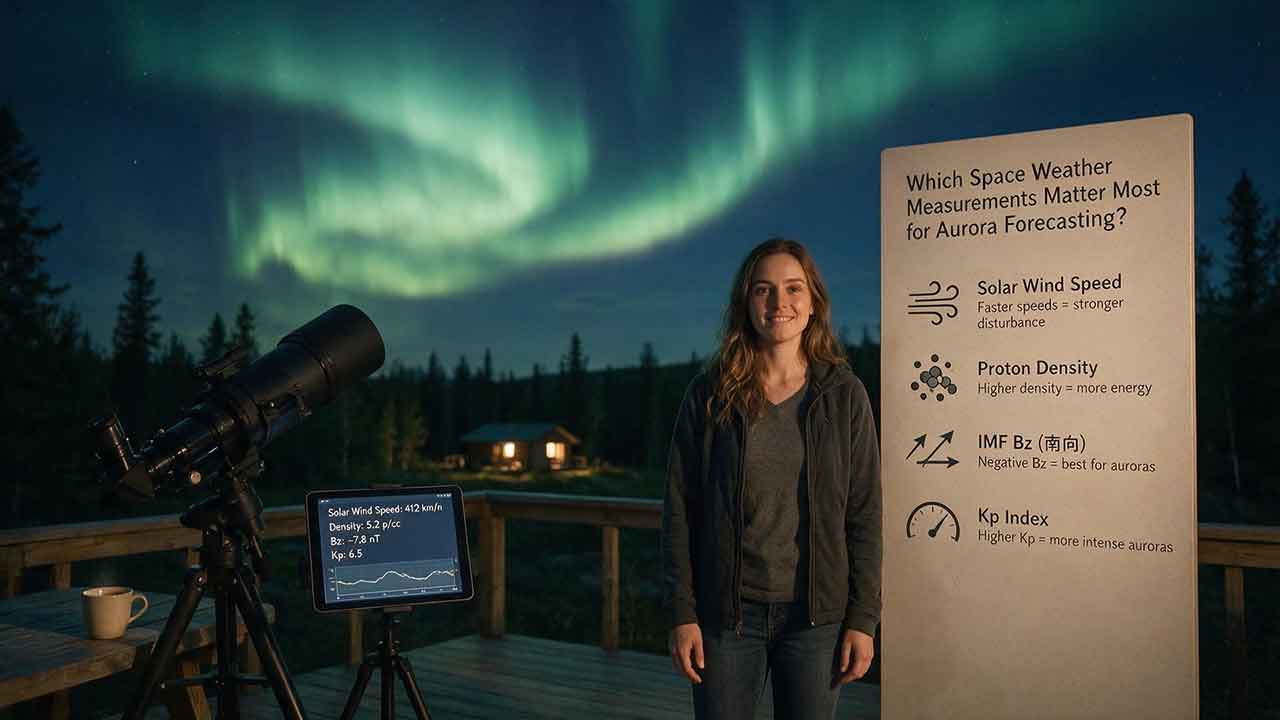
Which Space Weather Measurements Matter Most for Aurora Forecasting?
Aurora forecasting becomes more reliable when each space weather measurement is used for the right decision window. This guide explains why CME direction and propagation models matter several days ahead, while sustained southward Bz, total magnetic-field strength, solar-wind speed, density, and dynamic pressure become more useful as a disturbance approaches Earth. It also shows how Kp, auroral-oval maps, hemispheric power, AE, Dst, and local magnetometers answer different forecasting questions. Readers will learn a practical Signal–Coupling–Response–Visibility framework, compare upstream warning time with NOAA’s auroral-model guidance, work through a dynamic-pressure example, and troubleshoot conflicting forecast signals. The article also explains commonly overvalued indicators, including flare class, isolated Bz spikes, and Kp values without local-time context. Designed for aurora viewers, photographers, and travelers, it provides a clear checklist for combining official space weather data with darkness, cloud cover, road safety, and horizon visibility—without promising that any single measurement can guarantee a visible display.
How Reliable Are Aurora Forecast Apps?
Aurora forecast apps are useful for identifying periods of elevated geomagnetic activity, but they cannot guarantee that the northern lights will be visible from a specific location at a specific time. This guide explains why app alerts sometimes disagree, how forecast reliability changes as an event approaches, and which measurements deserve the most attention. Readers will learn how to interpret the auroral oval, observed and forecast Kp, solar-wind speed, Bz, cloud cover, darkness, timestamps, and official space-weather alerts. The article also introduces the Signal-to-Sky Reliability Framework, a viewing-location comparison tool, and a transparent method for auditing app notifications without inventing accuracy claims. Practical tables, troubleshooting guidance, and a step-by-step verification process help casual observers, photographers, travelers, and lower-latitude aurora chasers decide when an alert is worth acting on. The guide is based on authoritative documentation and published research rather than hands-on commercial app rankings.
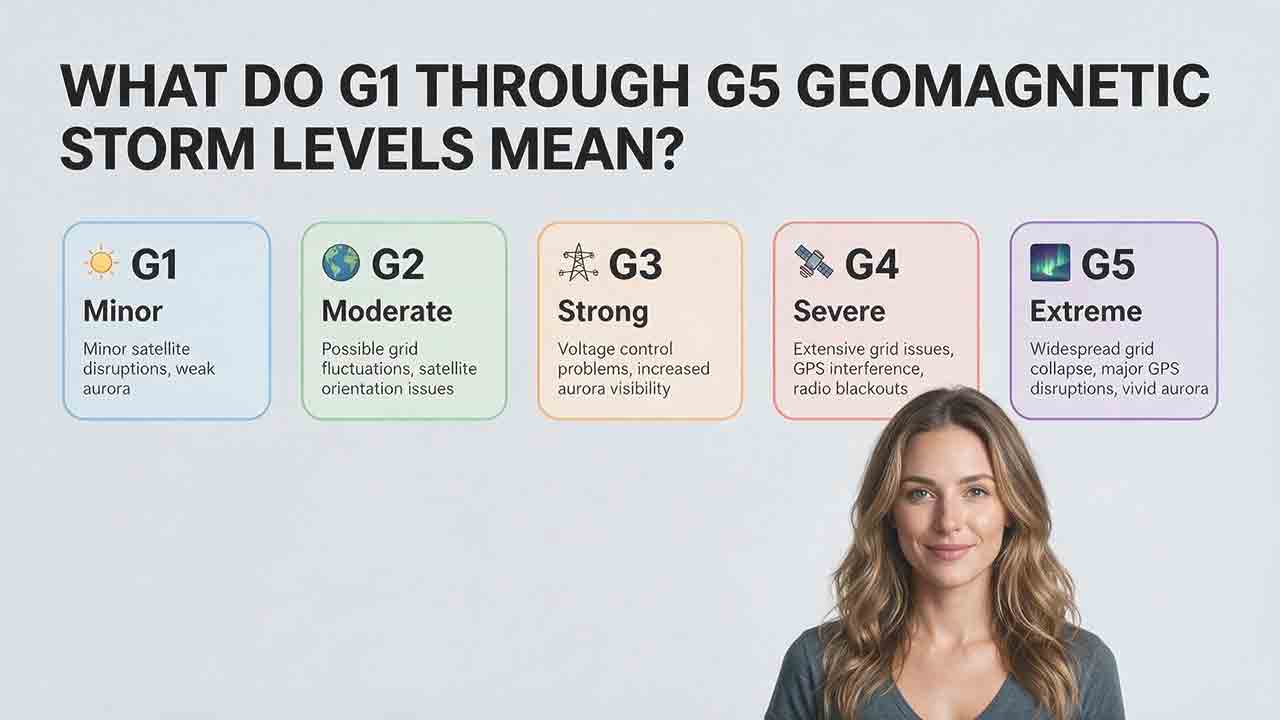
What Do G1 Through G5 Geomagnetic Storm Levels Mean?
NOAA’s G1 through G5 scale ranks geomagnetic storms from minor to extreme and translates planetary Kp measurements into practical impact categories. This guide explains the exact relationship between G levels and Kp notation, including why Kp 9− remains G4 while only Kp 9o qualifies as G5. It compares the possible effects of each level on aurora visibility, power systems, satellites, high-frequency radio, GPS, and precision navigation without treating those outcomes as guaranteed. Readers also learn how to distinguish a forecast, watch, warning, and observed alert; convert UTC forecast windows; interpret decimal Kp values such as 4.67 and 8.67; and apply the Scale–Status–Window–Location–System framework. Practical tables, a G3 watch example, common mistakes, and user-specific recommendations help the public, aurora observers, and technical users respond appropriately without unnecessary alarm.
Explore More Topics

How to Photograph the Northern Lights
Photographing the Northern Lights requires more than choosing one fixed camera setting. This practical guide explains how to select a camera and lens, focus accurately on stars, stabilize your equipment, and adjust shutter speed, aperture, and ISO according to the aurora’s brightness and movement. It includes starting settings for fast, moderate, and faint displays, along with a Motion–Brightness–Foreground framework that helps photographers make better decisions as conditions change. Readers will also learn how to use a smartphone Night mode, compose a stronger foreground, protect color-channel highlights, edit images responsibly, and disclose exposure blends clearly. A quick-reference card, three-frame comparison method, packing checklist, safety guidance, and detailed troubleshooting table make the article useful in the field. The guide relies on published guidance from NASA, NOAA, Nikon, Canon, and Apple while clearly distinguishing authoritative information from adjustable photography recommendations.

How Far South Can the Northern Lights Be Seen?
The northern lights usually remain within high-latitude regions, but powerful geomagnetic storms can carry visible aurora surprisingly far south. This guide explains why there is no single worldwide southern boundary and shows how geomagnetic latitude, the auroral oval, Kp, storm intensity, emission altitude, darkness, cloud cover, and local light pollution affect what an observer may see. It examines NOAA’s generalized U.S. visibility examples for G1 through G5 storms, while clarifying that locations such as Alabama, Florida, and southern Texas represent rare historical possibilities rather than guaranteed forecast limits. Readers will also find an original four-gate decision framework, an auditable geometric viewing-distance example, regional viewing guidance, a practical checklist, and troubleshooting advice for distinguishing faint aurora from clouds or artificial sky glow. The article helps observers decide when a forecast justifies going outside or traveling to a safer, darker viewing site.
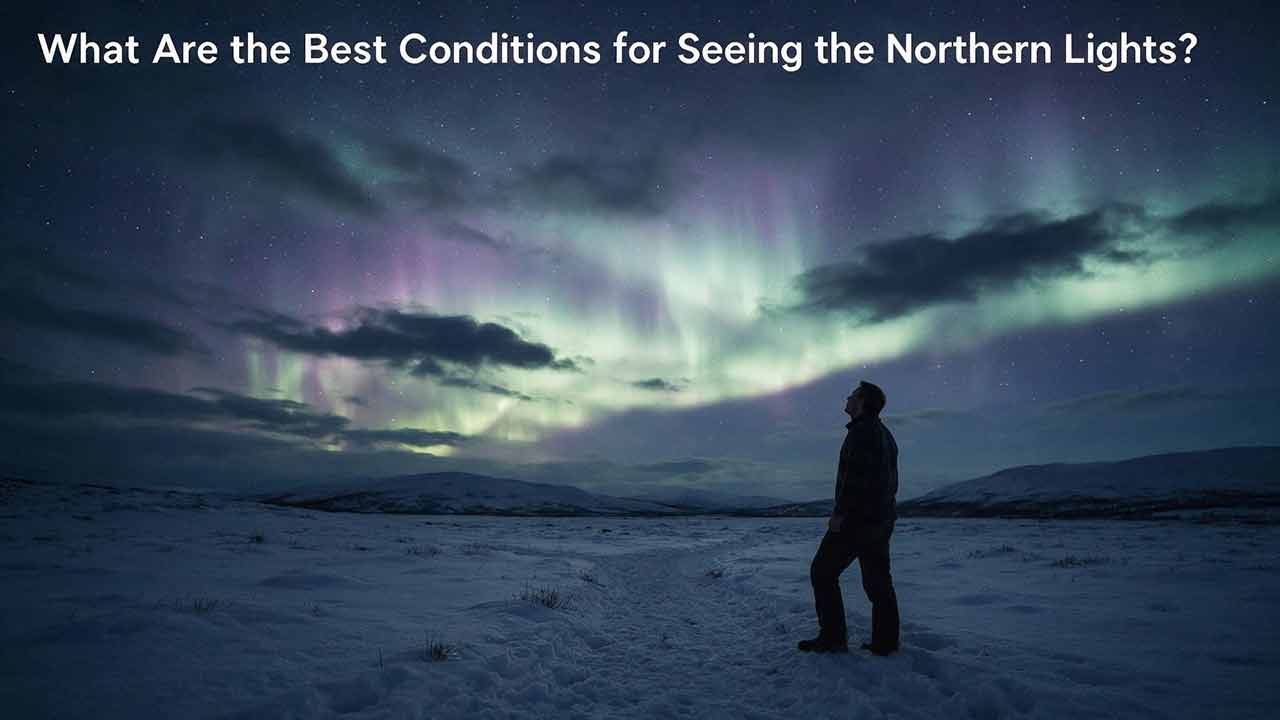
What Are the Best Conditions for Seeing the Northern Lights?
The best Northern Lights viewing conditions occur when geomagnetic activity, clear weather, darkness, and a suitable observing location align. This guide explains why the position of the auroral oval matters more than relying on a single Kp value and shows how cloud cover, twilight, light pollution, moonlight, atmospheric transparency, and horizon visibility affect what an observer can see. It introduces the Five-Gate Aurora Viewing Framework, a practical planning tool that evaluates aurora activity, clouds, darkness, location, and available viewing time without presenting the result as a guaranteed probability. Readers will also learn how to compare short- and long-range forecasts, convert UTC forecast periods, choose a safe dark-sky site, recognize faint aurora, and troubleshoot a promising forecast that produces no visible display. The article is based on guidance from NOAA, NASA, the University of Alaska Fairbanks, and the National Park Service.