How Far South Can the Northern Lights Be Seen?

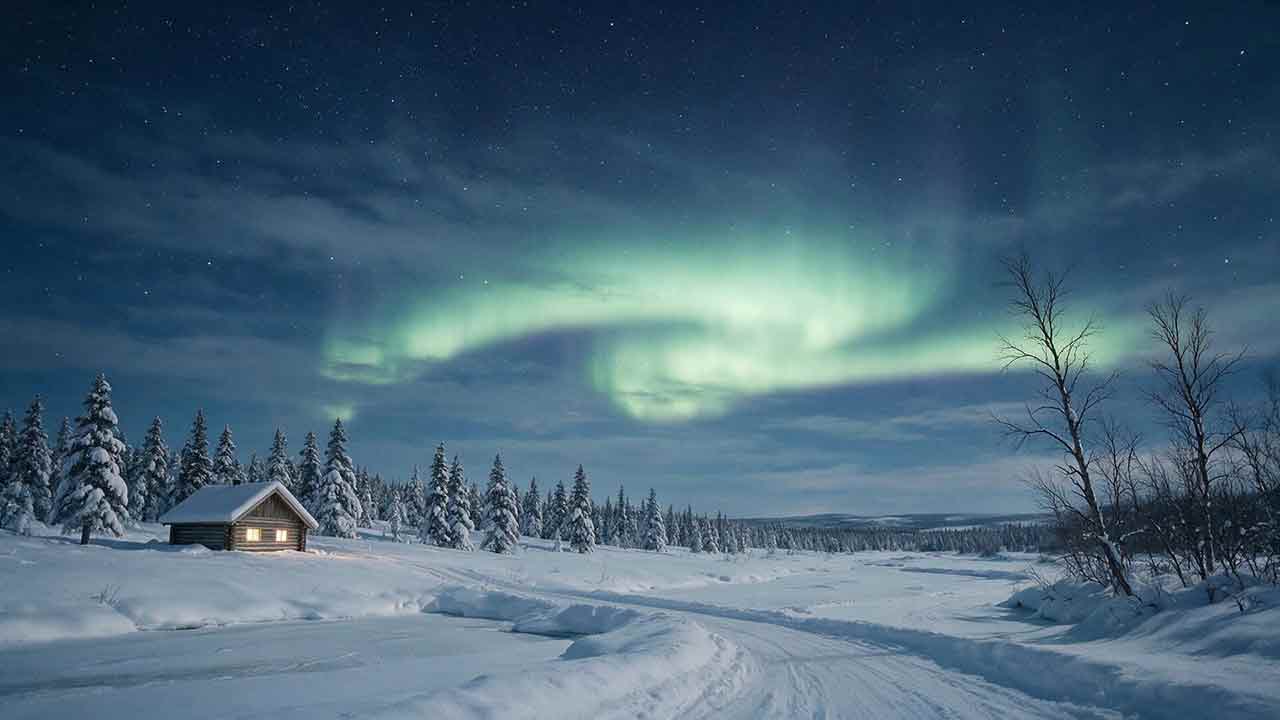
How Far South Can the Northern Lights Be Seen?
The northern lights are usually seen at high latitudes, but strong geomagnetic storms can push visible aurora far into the middle latitudes. In the United States, NOAA gives historical visibility examples as far south as Alabama and northern California during G4 storms, and Florida and southern Texas during G5 storms. These are rare examples, not fixed forecast boundaries or guarantees.
Key Takeaways
- The aurora follows Earth’s magnetic field, so geomagnetic latitude matters more than geographic latitude.
- NOAA’s state examples describe how far aurora has been seen during past storm levels; they do not predict a precise southern boundary.
- A southern observer may see a distant glow near the northern horizon even when the active aurora remains hundreds of kilometers farther north.
- Kp is useful for screening an event, but the auroral oval, darkness, cloud cover, local light pollution, and real-time activity determine whether the display is actually visible.
- Bright aurora can occasionally be detected from roughly 1,000 kilometers away under favorable conditions, although practical visibility is usually much less.
This guide explains the realistic southern limits of the northern lights, which parts of the answer apply globally, and how to decide whether an aurora forecast is worth acting on from your location.
How Far South Does the Aurora Normally Reach?
Under ordinary space-weather conditions, the northern lights remain concentrated in an auroral oval surrounding Earth’s magnetic pole.
The NOAA Space Weather Prediction Center describes the best regular viewing region as roughly 60° to 75° latitude. In practice, aurora forecasting is more precise when the observer’s position is considered relative to the magnetic pole rather than the geographic North Pole.
The normal viewing zone includes much of:
- Alaska
- Northern Canada
- Greenland
- Iceland
- Northern Norway, Sweden, and Finland
- Northern Russia
Observers beneath or close to the normal auroral oval may see displays during relatively modest geomagnetic activity. Someone much farther south usually needs a stronger storm before the oval expands far enough toward the equator.
There is no permanent southern edge. The oval contracts toward the pole during quieter conditions and expands toward lower geomagnetic latitudes when more energy enters Earth’s magnetosphere.
What Southern Aurora Examples Does NOAA Give for Each Storm Level?
NOAA’s geomagnetic-storm scale provides a useful U.S. reference for understanding how far south aurora has been seen during storms of different strengths.
The table below summarizes NOAA’s generalized U.S. visibility examples. It does not predict visibility for every city, county, or point at the same geographic latitude.
| NOAA storm level | Approximate Kp | NOAA’s U.S. aurora example | Practical meaning |
|---|---|---|---|
| Below G1 | Kp 0–4 | Mainly the normal high-latitude auroral zone | Most of the contiguous United States is unlikely to see aurora |
| G1, minor | Kp 5 | Commonly visible at high latitudes, including northern Michigan and Maine | Far-northern U.S. observers may have a chance from dark locations |
| G2, moderate | Kp 6 | Aurora has been seen as low as New York and Idaho | Northern-tier observers should monitor the oval and local skies |
| G3, strong | Kp 7 | Aurora has been seen as low as Illinois and Oregon | A broader part of the northern and central United States may have an opportunity |
| G4, severe | Kp 8 | Aurora has been seen as low as Alabama and northern California | Rare visibility becomes possible deep into the middle latitudes |
| G5, extreme | Kp 9 | Aurora has been seen as low as Florida and southern Texas | Exceptional low-latitude sightings may occur |
Source: NOAA Space Weather Scales.
The wording matters. NOAA says that aurora has been seen as low as these locations. The scale does not say that aurora will always reach those states whenever the corresponding storm level is announced.
A G3 forecast does not guarantee a display throughout Illinois. A G4 alert does not mean every observer in Alabama will see aurora. Longitude, storm timing, auroral brightness, cloud cover, darkness, and the direction of the horizon can all change the result.
Why Is There No Single Southern Latitude for the Northern Lights?
No fixed latitude can define the southern limit because aurora visibility depends on several variables that change independently.
How Does Geomagnetic Latitude Differ From Geographic Latitude?
Geographic latitude measures how far north or south a location lies relative to Earth’s equator.
Geomagnetic latitude measures a location’s position relative to Earth’s magnetic-field geometry. The geographic and magnetic poles are not in the same place, so two locations at the same geographic latitude may not have the same relationship to the auroral oval.
NASA has noted that aurora does not occur symmetrically around the geographic pole because it follows the magnetic field. This is one reason North American, European, and Asian locations at similar geographic latitudes can have different viewing probabilities.
For practical planning, a current aurora-oval map is more informative than a rule based only on degrees north.
How Does the Auroral Oval Change During a Storm?
The auroral oval is neither perfectly circular nor stationary.
As geomagnetic activity increases, the oval can:
- Expand toward lower geomagnetic latitudes
- Become brighter
- Develop uneven regions of activity
- Shift in response to changing solar-wind conditions
- Intensify temporarily during auroral substorms
The oval may expand strongly over one longitude while remaining less favorable over another. A global Kp value cannot describe all of this local structure.
Does “Visible From” Mean the Aurora Is Overhead?
No. An observer can see aurora from outside the active oval because auroral emissions occur high above Earth.
| Type of observation | Likely appearance | What it means |
|---|---|---|
| Overhead aurora | Arcs, rays, curtains, or movement across much of the sky | The active auroral region has expanded close to or over the observer |
| Horizon aurora | A low glow, pillars, or a colored band in the northern sky | The active aurora may still be hundreds of kilometers farther north |
| Camera-detected aurora | Color or faint structure appears in an exposure but is weak to the eye | The emission may be present below comfortable naked-eye visibility |
A report that aurora was “seen from Texas” does not necessarily mean green curtains were directly overhead. It may describe a faint red glow low in the north or a signal that was considerably clearer in a camera exposure.
Do the Same Southern Limits Apply in Europe and Asia?
The physical principles apply globally, but NOAA’s state examples should not be converted directly into European or Asian city thresholds.
The following conclusions are global:
- Aurora is organized around Earth’s magnetic poles.
- Stronger geomagnetic storms generally allow the oval to expand equatorward.
- Dark, clear skies are necessary for visual observation.
- A distant display may appear near the poleward horizon.
- Cameras can detect color and structure that the eye does not clearly perceive.
The following examples are U.S.-specific:
- New York and Idaho at G2
- Illinois and Oregon at G3
- Alabama and northern California at G4
- Florida and southern Texas at G5
A European city and a North American city at the same geographic latitude can have different geomagnetic latitudes. The same is true in Asia. A simple table that assigns a fixed Kp value to every international city would therefore be misleading.
Observers outside the United States should use:
- Their local or regional space-weather service
- A current Northern Hemisphere auroral-oval map
- Their location’s relationship to the magnetic pole
- Local darkness and cloud forecasts
- Real-time reports from locations farther poleward
The NOAA 30-Minute Aurora Forecast displays both Northern and Southern Hemisphere auroral activity and is more globally useful than a state-based visibility list.
How Can Aurora Be Seen From So Far Away?
Aurora can be visible over long distances because the emissions form high in the atmosphere.
NOAA gives a broad typical altitude range of approximately 80 to 500 kilometers. Green aurora is commonly produced around 100 to 200 kilometers, while red oxygen emissions can occur above 200 kilometers, according to NASA’s aurora overview.
A high, bright emission can remain above the geometric horizon for observers well outside the active auroral oval.
What Is the Idealized Geometric Viewing Distance?
A simplified spherical-Earth calculation estimates the straight-line distance from an auroral emission at altitude (h) to its geometric horizon:
[d = \sqrt{2Rh + h2}]
where:
- (d) is the straight-line geometric distance to the horizon,
- (R) is Earth’s approximate radius,
- (h) is the assumed altitude of the auroral emission.
For the estimates below, Earth’s radius is approximated as (R = 6{,}371\ \text{km}). The observer is treated as being at surface level, and the results are rounded to the nearest 10 kilometers.
The following distances are idealized geometric estimates, not practical viewing guarantees.
| Assumed auroral altitude | Approximate straight-line horizon distance |
|---|---|
| 100 km | 1,130 km |
| 250 km | 1,800 km |
| 400 km | 2,290 km |
These values represent idealized straight-line geometry from an elevated auroral emission to a surface-level observer. They do not include atmospheric extinction, refraction, terrain, cloud, haze, light pollution, auroral brightness, or the curvature-based surface distance between the observer and the emission’s ground projection.
Real-world visibility is usually much more restrictive. A low-altitude green arc may be hidden below the horizon while a high red emission remains geometrically visible.
NOAA states that bright aurora can sometimes be observed from as much as approximately 1,000 kilometers away when conditions are favorable. That statement is a practical upper-range example, not a promise that any aurora within 1,000 kilometers will be visible.
Why Is Red Aurora Often Reported Far South?
High red oxygen emissions can occur above much of the lower green aurora.
Because higher emissions remain above the horizon over greater distances, a southern observer may detect a red arc or diffuse red glow while the more familiar green structures remain below the horizon. The effect still depends on brightness; altitude alone does not make an emission visible.
This is why low-latitude reports often describe:
- A red or pink northern sky
- Faint red pillars
- A diffuse maroon glow
- Color that appears stronger in photographs than to the eye
Red color by itself is not proof of aurora. Illuminated clouds, distant city light, smoke, airglow, and aggressive image processing can produce similar colors.
How Far South Could Aurora Reach During an Extreme Storm?
The NOAA G5 scale gives Florida and southern Texas as historical U.S. visibility examples, corresponding generally to about 40° geomagnetic latitude.
Exceptional historical storms may have produced discrete overhead aurora even closer to the equator.
A 2025 study published through the U.S. Geological Survey examined reports of discrete aurora seen at the local zenith during major historical storms. Its statistical model estimated that:
- A roughly once-per-century storm could produce discrete overhead aurora down to about 34° geomagnetic latitude.
- A Carrington-class storm could produce discrete overhead aurora down to about 24° geomagnetic latitude.
These values are research-model estimates, not ordinary forecast thresholds. They refer to discrete aurora near the local zenith, which is a stricter condition than seeing a distant glow above the horizon.
They also do not mean every location at those geomagnetic latitudes would have clear skies, darkness, or an unobstructed view during such an event.
What Did the May 2024 Geomagnetic Storm Show?
The May 10–11, 2024 storm demonstrated that widespread low-latitude aurora is physically possible during an exceptional modern event.
NASA described it as the strongest geomagnetic storm in more than two decades. The storm reached G5, the highest NOAA geomagnetic-storm category, and produced aurora at unusually low latitudes across several parts of the world.
NASA satellite observations and ground reports showed broad auroral activity, although the appearance varied by time and location. Some observers saw vivid structure, while others recorded mainly red or pink light with cameras.
The event offers three useful lessons:
- Southern aurora reports are not automatically photographic mistakes.
- A broad G5 storm can still produce very different experiences at different longitudes.
- Real-time conditions and local weather remain more useful than assuming a historical event will repeat exactly.
The geographic reach of the May 2024 display should not be treated as a fixed boundary for future G5 storms. Storm orientation, timing, auroral brightness, longitude, darkness, and local weather can produce a different result during another event with the same headline classification.
See NASA’s May 2024 storm overview for the documented event.
Is Kp Enough to Predict How Far South Aurora Will Be Seen?
No. Kp is a useful first filter, but it is not a precise city-level visibility tool.
The Kp index summarizes planetary geomagnetic disturbance over three-hour intervals on a scale extending from quiet conditions to Kp 9. Higher Kp generally corresponds to a more disturbed magnetic field and greater potential for the auroral oval to expand.
However, Kp does not directly tell an observer:
- Whether the oval is bright at the observer’s longitude
- Whether a temporary substorm is occurring
- How high the visible emissions are
- Whether the observer is in darkness
- Whether clouds or haze block the sky
- Whether the aurora will be visible to the eye rather than only to a camera
A forecast Kp is also not the same as an observed Kp. Forecast values can be revised, missed, exceeded, or reached only briefly.
Which Forecast Tool Answers Which Question?
Each tool answers a different part of the viewing decision.
| Tool or measurement | Best question it answers | Main limitation |
|---|---|---|
| NOAA G-scale | How severe is the geomagnetic storm? | It describes broad storm effects, not a local sky |
| Forecast Kp | How disturbed might Earth’s magnetic field become? | It is planetary and predictive |
| Observed Kp | How disturbed was the recent three-hour interval? | It can lag fast changes |
| OVATION aurora map | Where is auroral activity likely in the next 30–90 minutes? | It is a model, not a visibility guarantee |
| Cloud and transparency forecast | Will the local sky be open enough to see faint light? | It does not measure auroral activity |
| Local cameras and observer reports | Is aurora appearing in or near the region now? | Cameras may show more than the human eye |
NOAA’s 30-Minute Aurora Forecast uses the OVATION model and upstream solar-wind measurements to estimate auroral location and intensity roughly 30 to 90 minutes ahead.
Use Kp to decide whether an event deserves attention. Use the oval map, local sky conditions, and real-time confirmation to decide whether to go outside.
How Can You Decide Whether the Aurora Might Reach Your Location?
The following Southward Aurora Decision Framework uses four gates. The farther south an observer is, the more important it becomes for all four gates to be favorable.
Gate 1: Is the Storm Strong Enough for Your Region?
Use the NOAA G-scale as an initial filter.
- Normal auroral-zone observer: Aurora may be possible without a formal geomagnetic storm.
- Northern-tier U.S. observer: G1 or G2 conditions can justify checking the sky and oval.
- Central U.S. observer: G3 provides a more meaningful reason to monitor real-time conditions.
- Southern U.S. observer: G4 or G5 is the most relevant rare-event range.
- Far-southern observer: Require exceptional storm conditions and convincing real-time evidence before making a long trip.
These are planning categories, not hard geographic boundaries.
Gate 2: Is the Auroral Oval Close Enough?
Check a current aurora map rather than relying only on a Kp graphic or viral social-media forecast.
Look for:
- The oval’s equatorward edge
- The modeled intensity near your longitude
- The forecast timestamp
- Whether the relevant area is in darkness
- Whether the active region is close enough to appear above your poleward horizon
An observer can sometimes see bright aurora from outside the modeled oval, so being outside the colored region does not always mean zero chance. The farther away you are, however, the more dependent the observation becomes on emission altitude, brightness, and horizon quality.
Gate 3: Can Your Local Sky Reveal a Faint Display?
A favorable space-weather forecast cannot overcome an opaque sky.
Check:
- Total cloud cover
- Low cloud, fog, or haze
- Wildfire smoke or dust
- Artificial light toward the poleward horizon
- Moonlight and lunar position
- Trees, hills, buildings, or mountains
- The beginning and end of astronomical darkness
A partly cloudy sky may still allow brief views. A continuous low cloud deck usually ends the viewing opportunity regardless of storm strength.
Gate 4: Is There Real-Time Confirmation?
Before making a long drive, look for evidence that the event is developing as forecast.
Useful confirmation includes:
- A NOAA storm alert or upgrade
- Expansion on the short-term aurora map
- Reports from trusted observers farther poleward
- Regional all-sky cameras
- A structured glow appearing in repeated test photographs
- Sustained rather than momentary geomagnetic activity
The University of Alaska Fairbanks Allsky Aurora Camera offers both a sensitive camera view and a reduced “Eyeball” view intended to better approximate what a person might see. The comparison illustrates why a camera image should not be treated as a precise measure of naked-eye brightness.
What Should Observers in Different Regions Expect?
If You Are Within the Normal Aurora Zone
Do not wait for a major storm.
Your main constraints are usually:
- Cloud cover
- Darkness
- Local light pollution
- Timing within the night
Modest activity can still produce worthwhile displays when the auroral oval is already near or above you.
If You Are in the Northern United States
G1 and G2 events are worth monitoring, particularly near the Canadian border.
Expect the best opportunities from a dark location with a clear northern horizon. During weaker events, the display may remain low and may appear pale or gray before color becomes obvious.
If You Are in the Central United States
Wait for a stronger event and real-time expansion.
A G3 storm can justify preparing, but the result may still be a distant northern glow. Reports from observers one or two states farther north can be more useful than a single forecast Kp number.
If You Are in the Southern United States
Treat southern aurora as an exceptional-event opportunity.
A G4 or G5 storm, clear air, full darkness, a dark northern horizon, and real-time confirmation should align before a long trip is justified. Even then, the view may be a subtle red glow rather than bright moving green curtains.
“Rare but possible” is the accurate expectation.
How Would the Decision Framework Work in Practice?
Consider an observer in the central United States during a forecast G3 storm.
The observer checks each gate:
- Storm strength: G3 is strong enough to justify monitoring.
- Auroral oval: The short-term map shows activity several hundred kilometers to the north.
- Local sky: Clouds are expected to clear after midnight, and a nearby rural site has an open northern horizon.
- Real-time confirmation: Observers farther north begin reporting a red arc and vertical structure.
The practical decision is to visit the nearby dark site, not to make an unplanned multi-hour drive based only on forecast Kp.
Now change one variable: the observer’s region is covered by solid low cloud for the entire forecast window. The space-weather event may still be impressive, but the correct local decision is not to travel.
The framework prevents one promising number from outweighing all the other conditions required for visibility.
What Should You Check Before Going Outside?
Space-Weather Check
- The forecast storm level is relevant to my region.
- I checked the forecast time and converted it correctly to local time.
- I checked a current auroral-oval map.
- I know whether the Kp value is forecast or observed.
- I looked for current reports from locations farther poleward.
Sky Check
- The sky is expected to be sufficiently clear.
- My location will be fully dark during the likely activity window.
- The poleward horizon is open.
- Strong city light is not directly beneath the likely display.
- Fog, smoke, haze, or dust is unlikely to hide a faint glow.
Expectation and Safety Check
- I understand that the aurora may be low on the horizon.
- I do not expect a camera image to match naked-eye brightness.
- I have chosen a legal viewing location with known access hours.
- I will not stop on an active roadway or unsafe shoulder.
- I have checked closures and private-property boundaries.
- Someone knows my destination if I am traveling to a remote site at night.
What Common Problems Cause False Alarms or Missed Displays?
| Situation | Likely explanation | Practical response |
|---|---|---|
| The forecast says aurora, but nothing is visible | The oval may be farther north, the active period may not have started, or the sky may be too bright or cloudy | Recheck the timestamp, oval, northern horizon, and real-time reports |
| A phone shows pink, but the eye sees gray | The aurora may be weak or subvisual, or the camera may be amplifying ordinary sky glow | Compare repeated images for moving or changing structure |
| People farther south report aurora | Their longitude, sky clarity, elevation, horizon, or camera sensitivity may differ | Do not use latitude alone to judge whether a report is credible |
| Kp is high, but the oval looks unfavorable | Kp is planetary and does not require equal expansion at every longitude | Give greater weight to the mapped oval and nearby observations |
| A red glow remains fixed above a city | Illuminated cloud or light pollution may be responsible | Move away from the light source and look for changing structure |
| Nothing appears overhead | Southern-edge aurora is often near the poleward horizon | Scan low from northwest through north to northeast |
A modern phone can detect faint auroral color more easily than the unaided eye. This does not make the photograph false, but it should be described accurately as camera-detected when the color or structure was not clearly visible in person.
Who Is This Guide For?
This guide is intended for:
- Casual observers deciding whether to step outside
- Travelers comparing aurora-viewing regions
- Photographers monitoring rare low-latitude events
- Readers interpreting G-scale and Kp claims
- People assessing viral “aurora as far south as” forecasts
This guide is not:
- A guarantee of visibility
- A live city-level prediction
- A replacement for NOAA or a regional forecast service
- A catalog of every historical low-latitude sighting
- Proof that every red or pink night-sky photograph shows aurora
How Does This Guide Separate Evidence, Calculation, and Advice?
Published scientific and operational facts in this article come from NOAA, NASA, USGS, and the University of Alaska Fairbanks.
The distance table is an explanatory calculation based on a spherical-Earth formula, a stated Earth radius, surface-level observer assumption, and rounded results. It is not an observational dataset or a practical visibility forecast.
The Southward Aurora Decision Framework is an editorial planning tool derived from the forecast variables discussed in the cited sources. It is designed to help readers organize a viewing decision, not to predict auroral visibility with scientific precision.
No original observations or personal aurora sightings are presented as scientific evidence. No professional scientific review is claimed.
What Should You Do Next?
The northern lights can occasionally be seen much farther south than their normal high-latitude zone, but the result depends on more than storm strength.
If you live beneath the normal auroral oval, prioritize darkness and cloud cover. If you live in the northern United States, monitor G1 and G2 events. Central U.S. observers should look for G3 conditions plus favorable real-time expansion. Southern observers should generally wait for an exceptional G4 or G5 event supported by clear skies and local confirmation.
Use the NOAA storm level to decide whether an event deserves attention. Use the auroral-oval map to evaluate location, the weather forecast to evaluate the sky, and real-time observations to decide whether travel is reasonable.
Frequently Asked Questions
Can the northern lights be seen in Florida?
Yes, but only during rare extreme geomagnetic storms. NOAA states that aurora has been seen as low as Florida and southern Texas during G5 conditions. A G5 storm still does not guarantee a visible display from every Florida location.
What Kp is needed to see aurora in the southern United States?
There is no guaranteed Kp threshold. Kp 8 or 9 conditions associated with G4 or G5 storms are the most relevant range for rare southern sightings, but local visibility still depends on the auroral oval, storm timing, darkness, cloud cover, and brightness.
Can aurora be visible from 1,000 kilometers away?
Yes, under favorable circumstances. NOAA states that bright aurora can sometimes be observed from approximately 1,000 kilometers away. This is not a standard viewing radius, and many displays will be invisible at much shorter distances.
Does a red northern sky always indicate aurora?
No. High-altitude red aurora can be visible during strong storms, but city light, clouds, smoke, haze, airglow, and camera processing can also create a red sky. Changing structure and independent forecast confirmation make an auroral identification more credible.
Is geomagnetic latitude more useful than geographic latitude?
Yes. The auroral oval is organized around Earth’s magnetic poles. Two places at the same geographic latitude can therefore have different aurora probabilities.
Could aurora appear farther south than NOAA’s G5 examples?
Possibly during an extraordinary historical-scale storm. A 2025 USGS-published model estimated that Carrington-class conditions could produce discrete overhead aurora down to approximately 24° geomagnetic latitude. This is a model estimate for an extreme event, not a normal forecast boundary.
Sources
Accessed and reviewed August 3, 2026.
- NOAA Space Weather Prediction Center: NOAA Space Weather Scales — G1–G5 storm categories, Kp measures, and generalized U.S. aurora examples.
- NOAA Space Weather Prediction Center: Aurora — Auroral formation, altitude range, normal viewing zone, and equatorward expansion.
- NOAA Space Weather Prediction Center: Aurora—30 Minute Forecast — OVATION short-term forecast, auroral location, forecast lead time, and long-distance visibility guidance.
- NASA Science: Auroras — Aurora colors, atmospheric gases, and approximate emission altitudes.
- NASA Earth Observatory: Historic Geomagnetic Storm Dazzles — Documentation of the May 10–11, 2024 G5 storm and low-latitude aurora.
- U.S. Geological Survey: What Is the Lowest Latitude of Discrete Aurorae During Superstorms? — Statistical estimates for overhead discrete aurora during exceptional storms.
- University of Alaska Fairbanks Geophysical Institute: Allsky Aurora Camera — Live aurora-camera observations.
- University of Alaska Fairbanks: Camera and Eyeball View Setup — Explanation of the sensitive camera display and reduced naked-eye simulation.
More from Aurora Forecasting & Viewing
How to Photograph the Northern Lights
Photographing the Northern Lights requires more than choosing one fixed camera setting. This practical guide explains how to select a camera and lens, focus accurately on stars, stabilize your equipment, and adjust shutter speed, aperture, and ISO according to the aurora’s brightness and movement. It includes starting settings for fast, moderate, and faint displays, along with a Motion–Brightness–Foreground framework that helps photographers make better decisions as conditions change. Readers will also learn how to use a smartphone Night mode, compose a stronger foreground, protect color-channel highlights, edit images responsibly, and disclose exposure blends clearly. A quick-reference card, three-frame comparison method, packing checklist, safety guidance, and detailed troubleshooting table make the article useful in the field. The guide relies on published guidance from NASA, NOAA, Nikon, Canon, and Apple while clearly distinguishing authoritative information from adjustable photography recommendations.
What Are the Best Conditions for Seeing the Northern Lights?
The best Northern Lights viewing conditions occur when geomagnetic activity, clear weather, darkness, and a suitable observing location align. This guide explains why the position of the auroral oval matters more than relying on a single Kp value and shows how cloud cover, twilight, light pollution, moonlight, atmospheric transparency, and horizon visibility affect what an observer can see. It introduces the Five-Gate Aurora Viewing Framework, a practical planning tool that evaluates aurora activity, clouds, darkness, location, and available viewing time without presenting the result as a guaranteed probability. Readers will also learn how to compare short- and long-range forecasts, convert UTC forecast periods, choose a safe dark-sky site, recognize faint aurora, and troubleshoot a promising forecast that produces no visible display. The article is based on guidance from NOAA, NASA, the University of Alaska Fairbanks, and the National Park Service.
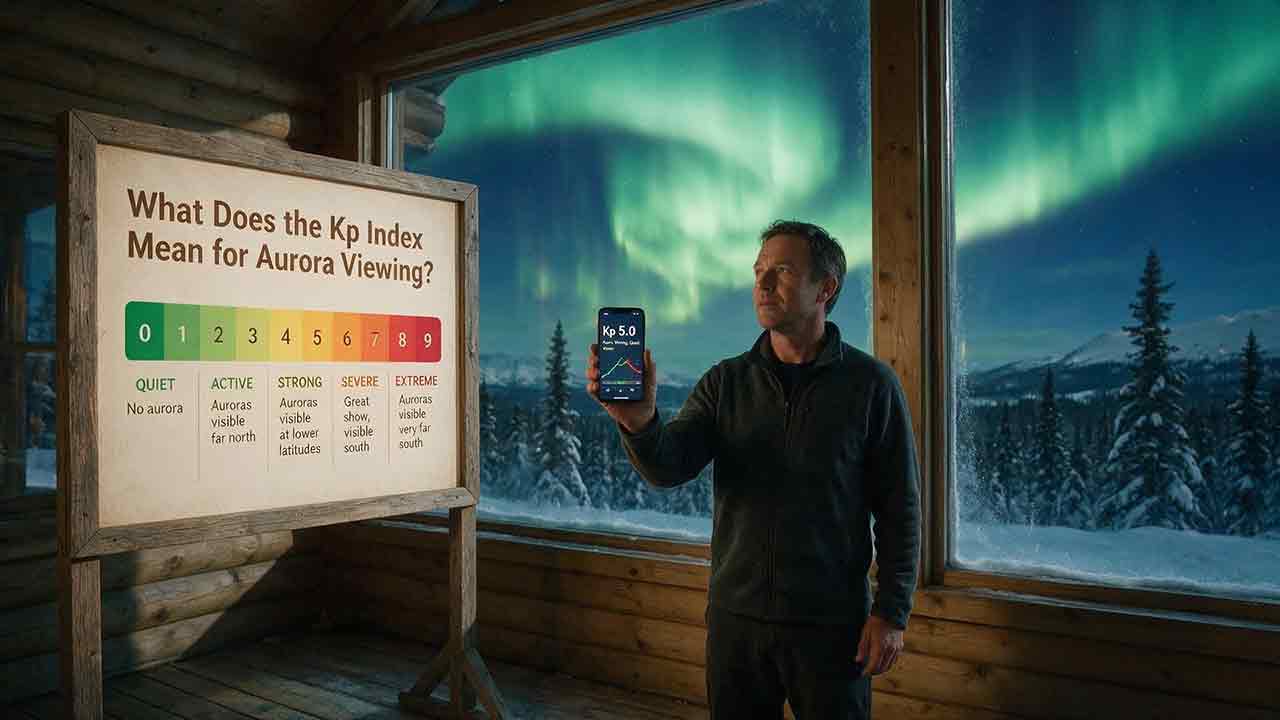
What Does the Kp Index Mean for Aurora Viewing?
The Kp index measures global geomagnetic activity on a scale from 0 to 9, but it is not a local aurora brightness score. This practical guide explains what different Kp levels mean, how NOAA’s G1–G5 storm categories relate to Kp, and why magnetic latitude, the auroral oval, cloud cover, darkness, and timing still determine whether the northern or southern lights are visible. Readers will learn how to interpret three-hour UTC forecasts, understand decimal and traditional Kp notation, and avoid common mistakes such as waiting for Kp 5 inside the normal auroral zone. The article also introduces the original Reach–Timing–Sky–Signal framework, a viewing decision matrix, troubleshooting guidance, and a pre-departure checklist. Using authoritative NOAA and GFZ documentation, it turns a global space-weather measurement into a realistic decision tool for travelers, photographers, high-latitude residents, and middle-latitude aurora watchers.
Explore More Topics
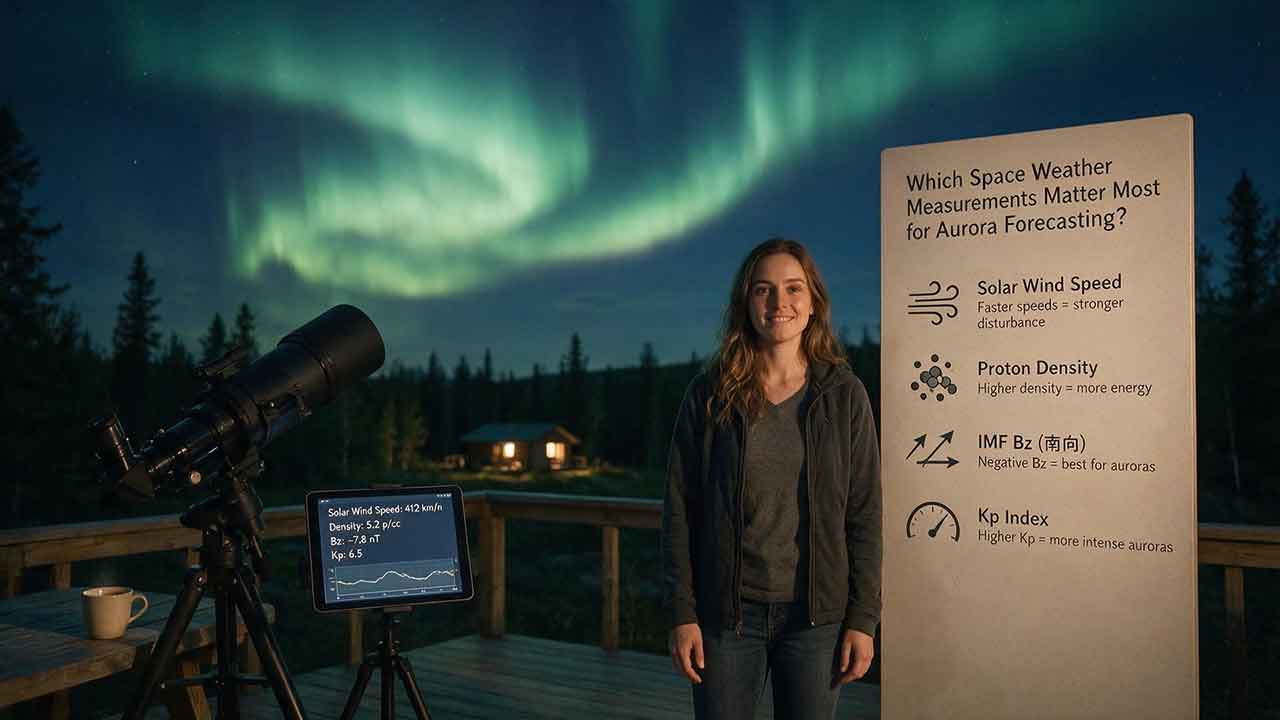
Which Space Weather Measurements Matter Most for Aurora Forecasting?
Aurora forecasting becomes more reliable when each space weather measurement is used for the right decision window. This guide explains why CME direction and propagation models matter several days ahead, while sustained southward Bz, total magnetic-field strength, solar-wind speed, density, and dynamic pressure become more useful as a disturbance approaches Earth. It also shows how Kp, auroral-oval maps, hemispheric power, AE, Dst, and local magnetometers answer different forecasting questions. Readers will learn a practical Signal–Coupling–Response–Visibility framework, compare upstream warning time with NOAA’s auroral-model guidance, work through a dynamic-pressure example, and troubleshoot conflicting forecast signals. The article also explains commonly overvalued indicators, including flare class, isolated Bz spikes, and Kp values without local-time context. Designed for aurora viewers, photographers, and travelers, it provides a clear checklist for combining official space weather data with darkness, cloud cover, road safety, and horizon visibility—without promising that any single measurement can guarantee a visible display.
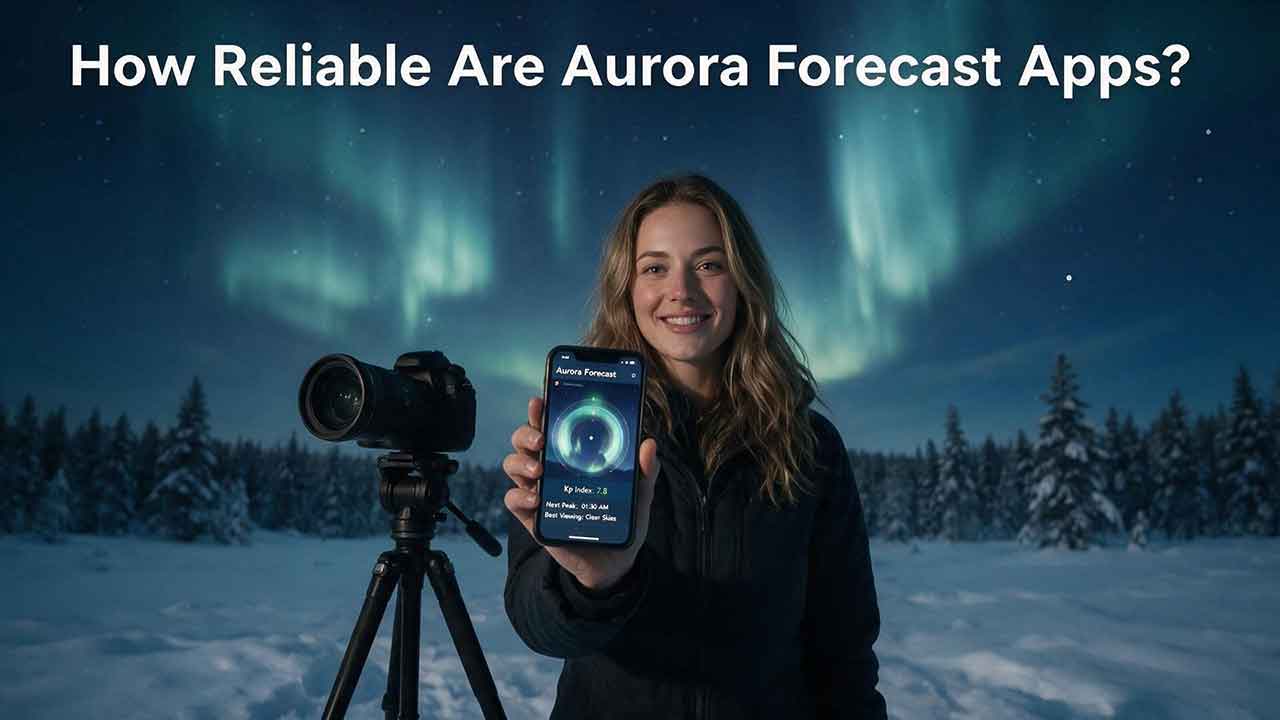
How Reliable Are Aurora Forecast Apps?
Aurora forecast apps are useful for identifying periods of elevated geomagnetic activity, but they cannot guarantee that the northern lights will be visible from a specific location at a specific time. This guide explains why app alerts sometimes disagree, how forecast reliability changes as an event approaches, and which measurements deserve the most attention. Readers will learn how to interpret the auroral oval, observed and forecast Kp, solar-wind speed, Bz, cloud cover, darkness, timestamps, and official space-weather alerts. The article also introduces the Signal-to-Sky Reliability Framework, a viewing-location comparison tool, and a transparent method for auditing app notifications without inventing accuracy claims. Practical tables, troubleshooting guidance, and a step-by-step verification process help casual observers, photographers, travelers, and lower-latitude aurora chasers decide when an alert is worth acting on. The guide is based on authoritative documentation and published research rather than hands-on commercial app rankings.
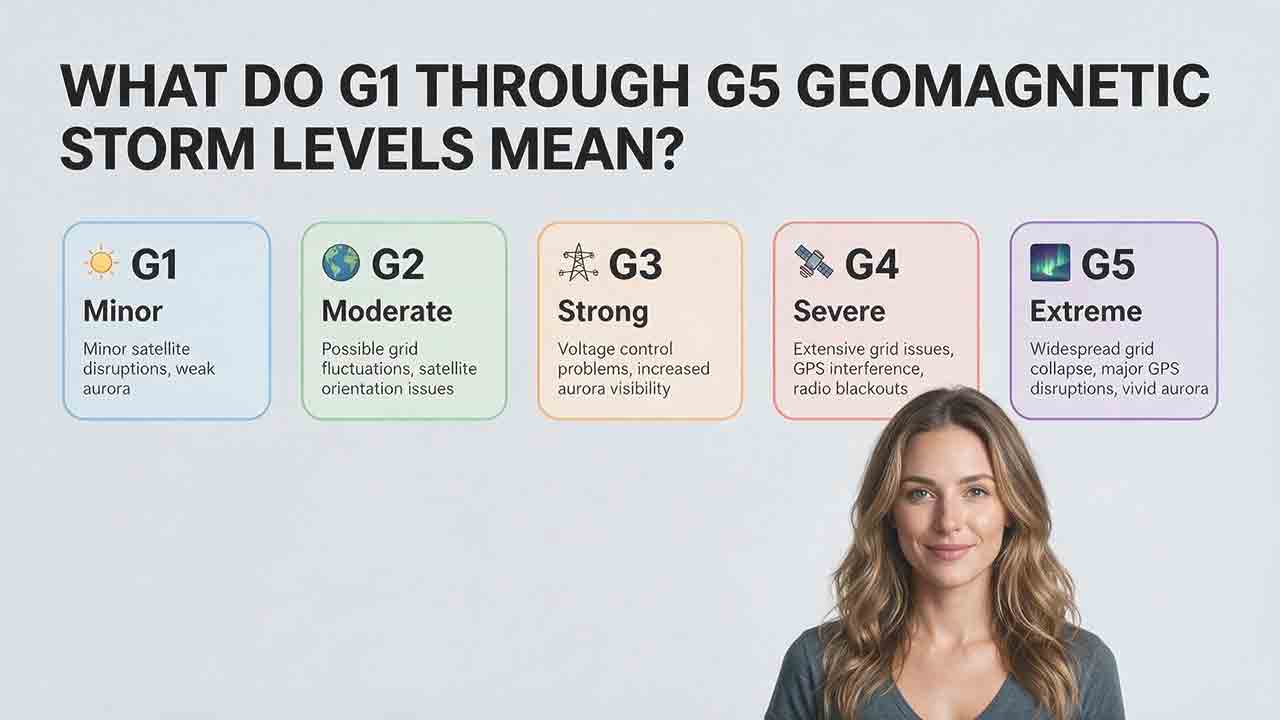
What Do G1 Through G5 Geomagnetic Storm Levels Mean?
NOAA’s G1 through G5 scale ranks geomagnetic storms from minor to extreme and translates planetary Kp measurements into practical impact categories. This guide explains the exact relationship between G levels and Kp notation, including why Kp 9− remains G4 while only Kp 9o qualifies as G5. It compares the possible effects of each level on aurora visibility, power systems, satellites, high-frequency radio, GPS, and precision navigation without treating those outcomes as guaranteed. Readers also learn how to distinguish a forecast, watch, warning, and observed alert; convert UTC forecast windows; interpret decimal Kp values such as 4.67 and 8.67; and apply the Scale–Status–Window–Location–System framework. Practical tables, a G3 watch example, common mistakes, and user-specific recommendations help the public, aurora observers, and technical users respond appropriately without unnecessary alarm.