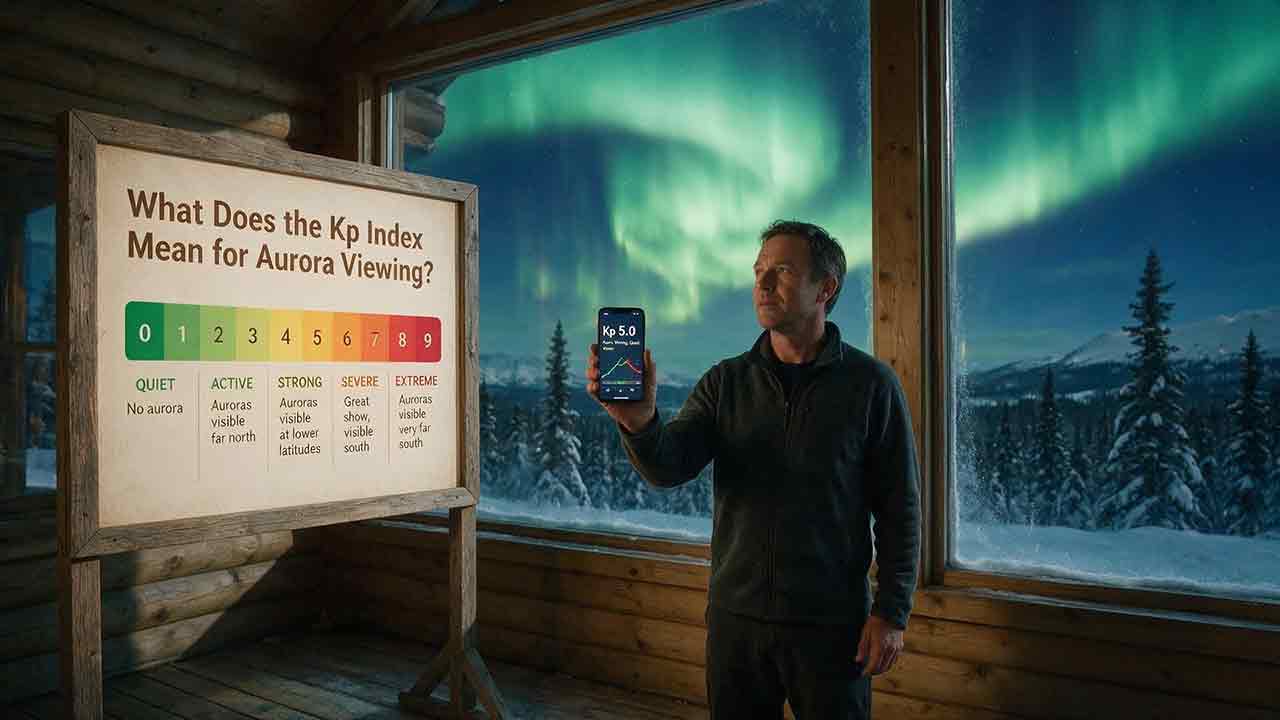
What Does the Kp Index Mean for Aurora Viewing?

What Does the Kp Index Mean for Aurora Viewing?
The Kp index summarizes global geomagnetic activity on a scale from 0 to 9. For aurora viewing, a higher Kp generally means the auroral oval may become more active and expand farther from the magnetic poles. However, Kp does not predict the exact brightness, timing, or visibility of the aurora from one location.
Key Takeaways
- Kp measures planetary geomagnetic disturbance, not aurora brightness above a specific city.
- Low Kp values can still produce excellent displays inside the normal auroral zone.
- NOAA begins its G1 geomagnetic-storm category at the Kp 5 range.
- Kp is reported for three-hour UTC intervals, so correct time conversion matters.
- A useful viewing decision combines Kp with the auroral oval, darkness, cloud cover, and current activity.
This guide will help you interpret Kp levels, understand their limitations, and decide whether conditions justify going outside or traveling to a darker viewing site.
Who Is This Guide For?
This guide is designed for:
- travelers planning an aurora-viewing trip;
- residents who live near the usual edge of the auroral oval;
- middle-latitude observers watching for geomagnetic storms;
- photographers deciding whether to visit a dark-sky site;
- beginners who find Kp forecasts confusing or contradictory.
It is not a city-level prediction service. No Kp value can guarantee that the aurora will be visible from a particular location at a particular time.
How Does the Kp Index Help With Aurora Viewing?
The Kp index helps viewers estimate how disturbed Earth’s magnetic field is and whether the auroral oval may expand beyond its usual position.
The NOAA Space Weather Prediction Center’s Planetary K-index page describes Kp as a three-hour planetary measure used to characterize geomagnetic disturbances. The official international Kp index is produced by the GFZ Helmholtz Centre for Geosciences from standardized geomagnetic observations.
Kp is useful for broad planning because it answers a regional question:
How widespread might geomagnetic activity become during this three-hour period?
It does not answer the more local question:
Will I see a bright aurora from this exact viewing site?
Local visibility also depends on whether the auroral oval reaches your area, whether the sky is dark and clear, and whether the strongest activity occurs while you are watching.
How Is Kp Different From a Local K Index?
A local K index describes magnetic disturbance recorded at one geomagnetic observatory.
Kp combines standardized measurements from multiple observatories to describe planetary activity. According to GFZ, the official Kp calculation uses observations from 13 contributing geomagnetic observatories.
A local magnetometer may reveal changes near one region more quickly or clearly. Kp is better for comparing overall activity across different days and events.
What Do Different Kp Levels Mean for Aurora Viewing?
The following table provides a practical interpretation rather than a guaranteed visibility boundary.
| Kp level | General condition | Practical meaning for an aurora viewer |
|---|---|---|
| 0–1 | Quiet | Aurora can remain visible within the core auroral zone, although activity may be limited in geographic reach. |
| 2 | Quiet to unsettled | A normal and potentially productive level for high-latitude destinations beneath the auroral oval. |
| 3 | Unsettled | Aurora may become more dynamic or extend modestly beyond its quiet-time position. |
| 4 | Active | The chance of seeing aurora near the usual edge of the oval may improve. |
| 5 range | G1 minor storm | The oval may expand equatorward of its usual position. Visibility beyond the normal auroral zone becomes more plausible, but no city-level boundary is guaranteed. |
| 6 range | G2 moderate storm | A more substantial oval expansion is possible, increasing opportunities at some middle and high geomagnetic latitudes. |
| 7 range | G3 strong storm | Widespread aurora may become possible well beyond the normal auroral zone. |
| 8 to 9− | G4 severe storm | Rare and extensive displays may reach considerably lower geomagnetic latitudes. |
| 9o | G5 extreme storm | Exceptionally widespread aurora is possible, although weather, darkness, local time, and oval position still control ground visibility. |
Any latitude examples associated with these levels are historical geomagnetic-latitude references, not guaranteed geographic viewing boundaries.
How Do NOAA’s G1–G5 Levels Correspond to Kp?
The NOAA Space Weather Scales classify geomagnetic storms as follows:
| NOAA storm level | Kp range used by NOAA |
|---|---|
| G1 minor | Kp 5 range |
| G2 moderate | Kp 6 range |
| G3 strong | Kp 7 range |
| G4 severe | Kp 8 through 9− |
| G5 extreme | Kp 9o |
In traditional notation, 9− is the step immediately below 9.00, while 9o represents the maximum Kp value of 9.00. The character o is a lowercase letter, not the number zero. There is no conventional 9+ value.
NOAA’s decimal forecasts may display 4.67 and mark it as G1 because 4.67 represents the traditional 5− step.
G1 through G5 describe the severity of a geomagnetic storm and its possible technological and geographic effects. They are not local aurora-brightness ratings.
What Do NOAA’s Latitude Examples Really Mean?
NOAA provides historical examples showing how far equatorward aurora has sometimes been observed during major storms:
- G2: approximately 55° geomagnetic latitude;
- G3: approximately 50° geomagnetic latitude;
- G4: approximately 45° geomagnetic latitude;
- G5: approximately 40° geomagnetic latitude.
These examples do not mean that the entire latitude circle will see aurora during every storm of that category. They also refer to geomagnetic latitude rather than ordinary geographic latitude.
Local darkness, cloud cover, storm duration, auroral-oval geometry, horizon access, and observation timing remain decisive.
Can Kp 2 Produce a Better Aurora Display Than Kp 5?
Yes.
An observer directly beneath the auroral oval during Kp 2 may see bright arcs, rays, curtains, and rapid movement overhead. An observer farther from the oval during Kp 5 may see only a weak glow near the poleward horizon.
The difference is location.
Kp 5 suggests that geomagnetic activity is more disturbed globally and that the oval may expand farther than usual. It does not mean every observer will see an aurora brighter than every display occurring at Kp 2.
This is why experienced high-latitude viewers do not automatically wait for storm-level Kp values.
Why Is Kp Not a Simple Linear Scale?
Kp is a quasi-logarithmic index. Moving from Kp 4 to Kp 6 represents a much larger change in geomagnetic disturbance than the two-number difference suggests.
GFZ also publishes ap, a linearized index derived from Kp. The GFZ Kp and ap format documentation gives the following corresponding values:
| Kp | Corresponding ap |
|---|---|
| 4o | 27 |
| 5o | 48 |
| 6o | 80 |
A simple comparison shows the difference:
80 ÷ 27 = approximately 2.96
The linearized value associated with Kp 6o is therefore almost three times the value associated with Kp 4o.
This calculation does not mean that a Kp 6 aurora will appear three times brighter. It demonstrates why Kp should not be interpreted as a percentage or a simple one-to-nine intensity dial.
What Do Kp Decimals, Plus Signs, and Minus Signs Mean?
Traditional Kp notation divides most integer levels into three steps:
- minus;
- exact integer, shown with
o; - plus.
The complete scale contains 28 values from 0o to 9o.
| Traditional notation | Decimal representation |
|---|---|
| 4− | 3.67 |
| 4o | 4.00 |
| 4+ | 4.33 |
| 5− | 4.67 |
| 5o | 5.00 |
| 5+ | 5.33 |
| 6− | 5.67 |
| 6o | 6.00 |
A displayed value of 4.67 is not an unrestricted measurement that happened to land near 4.7. It represents one of the standardized thirds of the Kp scale.
Different services may round or label these values differently. Before comparing two forecasts, check whether each service uses traditional notation, decimal notation, or whole-number categories.
Does Kp Tell You How Far South or North the Aurora Will Be Visible?
Kp indicates the potential for the auroral oval to expand, but it cannot draw an exact city-by-city boundary.
Several physical and observational limits make a universal Kp latitude chart unreliable.
Geographic Latitude Is Not Geomagnetic Latitude
Auroral activity is organized around Earth’s magnetic poles, which are offset from the geographic poles.
Two cities located at the same geographic latitude can have different geomagnetic latitudes and different chances of seeing aurora during the same event.
This difference is especially important in North America, Europe, and Asia, where the geographic shape of the continents can make simple latitude comparisons misleading.
The Auroral Oval Changes Shape
The auroral oval is not a fixed, perfectly circular ring.
It changes in:
- width;
- intensity;
- position;
- local-time distribution;
- activity on the dawn and dusk sides;
- distance from the magnetic pole.
A planetary Kp number cannot describe all of those regional variations.
Aurora Can Be Visible Beyond the Oval
You do not always need to stand directly beneath active aurora.
NOAA notes on its Aurora 30-Minute Forecast page that bright aurora may sometimes be observed from as far as about 1,000 kilometers away when conditions are favorable.
At that distance, the display may appear as a low arc or glow near the poleward horizon rather than overhead curtains. Terrain, haze, clouds, artificial light, and Earth’s curvature can reduce that viewing range.
A Three-Hour Value Can Hide Shorter Changes
Kp summarizes a full three-hour interval. Aurora can intensify or fade on much shorter timescales.
A brief substorm may produce an excellent display during part of an otherwise moderate interval. Conversely, a high three-hour Kp value does not mean peak activity will continue for all three hours.
Which Forecast Tools Should You Use With Kp?
Kp is most useful when each forecast tool is assigned a specific job.
| Tool | Question it helps answer |
|---|---|
| Kp forecast | How disturbed may Earth’s magnetic field become? |
| Auroral-oval map | Where is auroral activity most likely in the near term? |
| Solar-wind measurements | Are incoming conditions becoming more or less favorable? |
| Cloud forecast | Will the sky be visible from the ground? |
| Darkness and twilight information | Will sunlight prevent visual observation? |
| Local camera or magnetometer | Is activity already developing near the region? |
NOAA’s OVATION-based aurora product provides an estimated 30- to 90-minute forecast of auroral location and intensity when suitable upstream solar-wind measurements are available. The lead time reflects the estimated travel time from the L1 monitoring location to Earth.
If the required solar-wind input is unavailable, NOAA may drive the model using current Kp instead, in which case the product may not provide meaningful forecast lead time.
How Can You Decide Whether to Go Aurora Viewing?
A useful viewing decision should pass four checks: Reach, Timing, Sky, and Signal.
This is an original editorial framework built from official Kp definitions and practical viewing constraints. It is not an official NOAA or GFZ forecast model.
1. Reach: Can the Aurora Plausibly Reach Your Area?
Determine whether your location is:
- normally inside the auroral zone;
- near its usual edge;
- or well outside it.
Kp is especially helpful for people near or beyond the normal edge. Someone in northern Alaska, northern Canada, Iceland, northern Scandinavia, or a comparable southern auroral region may see aurora at low Kp.
A middle-latitude observer usually needs a more substantial equatorward expansion.
2. Timing: Does the Activity Overlap Local Darkness?
Kp forecasts are organized into three-hour UTC periods:
- 00:00–03:00 UTC;
- 03:00–06:00 UTC;
- 06:00–09:00 UTC;
- 09:00–12:00 UTC;
- and so on.
Convert the relevant interval to local time. Confirm whether the conversion changes the calendar date and whether daylight-saving time applies.
A strong event during local daylight may produce significant geomagnetic activity without producing visible aurora for a ground observer.
3. Sky: Can You See the Stars and Poleward Horizon?
Check:
- total and low cloud cover;
- fog;
- precipitation;
- wildfire smoke;
- haze;
- twilight;
- moonlight;
- artificial light;
- terrain or buildings along the poleward horizon.
A clear Kp 3 night can offer a better practical opportunity than a fully overcast Kp 7 night.
4. Signal: Is Current Activity Supporting the Forecast?
Shortly before leaving, check:
- the current auroral oval;
- recent estimated Kp values;
- official geomagnetic watches, warnings, or alerts;
- local all-sky cameras;
- nearby magnetometer activity;
- current solar-wind trends.
A multi-day Kp forecast identifies a possible opportunity. Near-real-time observations show whether the opportunity is developing as expected.
Reach–Timing–Sky–Signal Decision Matrix
| Reach | Timing | Sky | Signal | Practical decision |
|---|---|---|---|---|
| Favorable | Favorable | Favorable | Favorable | Strong reason to observe now |
| Favorable | Favorable | Favorable | Uncertain | Prepare and continue monitoring |
| Marginal | Favorable | Favorable | Improving | Consider a nearby dark site |
| Marginal | Favorable | Poor | Strong | Look for a clearer location |
| Unfavorable | Favorable | Clear | Weak | Wait for greater oval expansion |
| Favorable | Daylight | Clear | Strong | Monitor, but visual observation must wait for darkness |
| Favorable | Dark | Overcast | Strong | Ground viewing is unlikely from that site |
The matrix is a decision-support tool, not a prediction of success.
How Do You Convert a Kp Forecast From UTC?
Suppose a forecast lists increased activity from 03:00 to 06:00 UTC.
If your location is using UTC−6:
- 03:00 UTC − 6 hours = 21:00 local time;
- 06:00 UTC − 6 hours = 00:00 local time.
The forecast interval therefore runs from 9:00 p.m. to midnight on the previous local date.
This date change causes many planning mistakes. An event labeled Saturday in UTC may begin on Friday evening for observers in North America.
Before traveling, confirm:
- the UTC interval;
- your current UTC offset;
- whether daylight-saving time is active;
- the resulting local calendar date;
- whether the app has already converted its chart to local time.
Do not assume that every forecast page uses your device’s time zone.
What Is the Difference Between Forecast, Estimated, Nowcast, and Definitive Kp?
The label attached to a Kp value matters.
| Kp data type | Meaning | Best use |
|---|---|---|
| Forecast Kp | Predicted activity for a future interval | Advance planning |
| Estimated Kp | Operational estimate produced before every final input is available | Monitoring current conditions |
| Nowcast Kp | Near-real-time value based on available observatory data | Event tracking |
| Definitive Kp | Quality-controlled official value released after complete processing | Research and historical analysis |
GFZ provides Kp as near-real-time nowcast values and later replaces them with monthly definitive values. The current data status and download options are explained on the GFZ Kp data page.
A revised nowcast does not mean the earlier display was fabricated. It means the operational value was calculated from incomplete or preliminary data and was later finalized.
What Are the Strengths and Limitations of Kp?
Where Kp Is Useful
Kp provides:
- a standardized measure of planetary geomagnetic activity;
- a simple way to compare quiet and disturbed periods;
- a common reference for NOAA storm categories;
- useful context for multi-day aurora planning;
- a warning that the oval may expand beyond its normal position.
It is especially valuable for people who live near the usual edge of auroral visibility.
Where Kp Is Limited
Kp does not provide:
- minute-by-minute timing;
- local cloud information;
- exact auroral-arc position;
- city-level brightness;
- a reliable visual-color forecast;
- the appearance of the display to a camera;
- certainty that activity will persist throughout an interval.
Kp is also capped at 9. Extremely strong events can differ in physical severity even when both receive the maximum Kp value.
Which Kp Levels Matter for Different Observers?
Viewers Inside the Core Auroral Zone
Do not wait for Kp 5.
Kp 1–3 can support worthwhile displays when the oval is correctly positioned. Cloud cover, darkness, and local auroral activity may be more important than the difference between two adjacent Kp levels.
Viewers Near the Normal Edge of the Oval
Kp 3–5 may deserve close attention.
A modest oval expansion can move aurora from below the horizon to a visible poleward arc. Check the short-term oval map instead of relying only on the predicted daily maximum.
Middle-Latitude Viewers
Storm-level conditions are generally more relevant, but there is no universal minimum.
Kp 5–7 may justify monitoring, depending on geomagnetic latitude and event geometry. Look for official storm alerts, oval expansion, clear skies, and observations from locations farther poleward.
Viewers Far Outside the Normal Auroral Zone
Unusually strong storms may be required.
Even during Kp 8 or 9, the display may be a faint red or pale glow low on the horizon. A camera may detect color before the unaided eye recognizes it.
Aurora Photographers
Photographers should weigh sky quality as heavily as Kp.
A clear Kp 2 display beneath the oval can produce stronger images than a Kp 7 event obscured by cloud. Dark surroundings, safe access, an open horizon, stable equipment, and suitable camera settings remain essential.
What Common Kp Mistakes Cause Missed Aurora?
Treating Kp as a Brightness Rating
Kp measures geomagnetic disturbance. It does not measure the brightness above your viewing site.
Better approach: Compare Kp with the current oval position.
Waiting for Kp 5 at High Latitudes
Travelers sometimes ignore low-Kp nights and miss normal auroral-zone activity.
Better approach: At high latitudes, prioritize darkness, cloud cover, and local activity.
Using Geographic Latitude as a Fixed Rule
Ordinary map latitude does not accurately represent a location’s relationship to Earth’s magnetic field.
Better approach: Use geomagnetic context and an auroral-oval map.
Reading Only the Daily Maximum
A daily forecast may advertise Kp 6 even when the Kp 6 interval occurs during daylight or before you arrive.
Better approach: Read the individual three-hour UTC periods.
Confusing Forecast Values With Observations
Forecast activity can arrive early, late, stronger, or weaker than predicted.
Better approach: Review current observations shortly before departure.
Traveling Toward an Overcast Site
A strong geomagnetic storm cannot make aurora visible through an opaque cloud layer.
Better approach: Keep a clear-sky backup location.
Comparing Phone Images With Naked-Eye Color
Phone and camera sensors can collect more light than the eye perceives in real time.
Better approach: Treat photographic detection and visual detection as related but different observations.
Why Might a High Kp Forecast Produce No Visible Aurora?
Use this troubleshooting sequence before deciding that the forecast was wrong.
- Confirm darkness. Twilight or moonlit haze may reduce contrast.
- Check low clouds and fog. A general weather icon may hide local cloud layers.
- Open the current oval map. Global activity may be strong while the oval remains too far away.
- Face the poleward horizon. Northern Hemisphere viewers generally look north; Southern Hemisphere viewers generally look south.
- Check the exact interval. The peak may have occurred earlier.
- Confirm the data type. You may be reading a future forecast rather than a current estimate.
- Reduce local light. Move away from streetlights and allow your eyes time to adapt.
- Check reports farther poleward. Activity may not yet have expanded to your area.
Why Might Aurora Look Strong During Low Kp?
You may be directly under the auroral oval.
A localized intensification can also develop within a three-hour interval that remains modest in the global Kp summary. Kp cannot represent every short-lived arc or substorm.
Why Do Different Websites Show Different Kp Values?
The websites may be displaying different:
- issue times;
- three-hour intervals;
- forecast models;
- estimated and definitive values;
- rounding systems;
- traditional and decimal notation.
Check the timestamp, source, time zone, interval, and data status before deciding that two sources conflict.
Why Does a Forecast Show 4.67 and Label It G1?
The decimal value 4.67 represents traditional Kp 5−. NOAA operational forecasts may classify this step within G1 conditions.
It is a standardized scale step rather than an arbitrary decimal reading.
What Should You Check Before Leaving Home?
Space-Weather Check
- Read the correct three-hour Kp interval.
- Confirm whether the value is forecast, estimated, nowcast, or definitive.
- Open the current auroral-oval forecast.
- Review official NOAA alerts or warnings.
- Check local aurora cameras or magnetometers when available.
- Convert UTC to local time and verify the calendar date.
Sky Check
- Confirm that the site will be fully dark.
- Review hourly low, middle, and high cloud cover.
- Check fog, smoke, haze, and precipitation.
- Consider twilight and moonlight.
- Find an unobstructed poleward horizon.
- Identify a backup site with clearer skies.
Travel and Safety Check
- Confirm that the road and observation site are legally accessible.
- Do not stop on an active road or block a gate or private entrance.
- Check wind, temperature, ice, snow, and coastal conditions.
- Carry suitable clothing, lights, communication equipment, and power.
- Tell someone your destination when traveling to a remote site.
- Follow local park, wildlife, fire, and emergency guidance.
Aurora viewing should not require unsafe driving, trespassing, standing on unstable ice, or ignoring severe weather warnings.
Practical Example: Is a 45-Minute Drive Worthwhile?
Consider a middle-latitude observer deciding whether to drive to a darker site.
The available information is:
- forecast peak: Kp 6;
- active interval: 03:00–06:00 UTC;
- local conversion: 9:00 p.m. to midnight;
- auroral oval: approaching the region but not directly overhead;
- cloud cover: 15% at the dark site and 70% at home;
- reports farther poleward: faint camera detections are beginning;
- viewing site: open poleward horizon with legal access.
Applying the Reach–Timing–Sky–Signal framework:
| Factor | Assessment |
|---|---|
| Reach | Marginal to favorable |
| Timing | Favorable |
| Sky | Favorable at the dark site |
| Signal | Improving |
The trip may be reasonable for an observer who accepts that the display could remain faint or confined to the horizon.
Now change one condition: the dark site becomes covered by low cloud.
The Kp forecast has not changed, but the practical decision has. The better choice is to find a clear alternative or remain home.
This is a worked planning example, not a record of a real observation or a scientifically validated prediction method.
How Should You Use Kp for Your Next Aurora Viewing Decision?
Use Kp as a measure of potential geographic reach, not as a promise of local visibility.
If you are already inside the auroral zone, check the oval and clouds rather than waiting for a major storm. If you live near the edge, monitor each three-hour interval and prepare a dark viewing site. At middle latitudes, combine storm alerts with real-time oval expansion and reports from farther poleward.
The practical sequence is:
- identify whether your location is plausibly within viewing range;
- convert the active UTC interval correctly;
- find clear, dark, legally accessible skies;
- confirm that current observations support the forecast;
- keep expectations proportional to your distance from the oval.
Kp is valuable because it narrows the decision. The complete viewing decision comes from combining space weather with conditions on the ground.
Frequently Asked Questions
Is Kp 3 good for seeing the northern lights?
Kp 3 can be very good inside or near the normal auroral zone. It may not be enough for locations much farther from the magnetic poles. The oval position and local sky conditions are more useful than applying one global minimum.
Does Kp 5 guarantee visible aurora?
No. Kp 5 indicates minor geomagnetic-storm conditions, but it does not guarantee that the auroral oval will be visible from a specific site. Darkness, weather, local time, and geomagnetic location still matter.
Can aurora appear at Kp 1 or Kp 2?
Yes. Aurora regularly occurs within high-latitude auroral regions during quiet geomagnetic conditions. Low Kp mainly means that broad equatorward expansion is less likely.
Is Kp 9 dangerous for people watching from the ground?
Kp is not a personal ground-level danger scale. Severe geomagnetic storms can affect power systems, satellites, radio communication, and navigation. Viewers should follow official emergency guidance and manage ordinary hazards such as weather, roads, cold, terrain, and remote travel.
Why does the Kp forecast change before an event?
Forecasts depend on solar-wind structures, coronal mass ejection arrival estimates, and magnetic conditions that continue to evolve. An event can arrive earlier, later, stronger, or weaker than initially expected.
Is Kp or the auroral-oval map more useful?
Kp is better for understanding global geomagnetic activity and possible oval expansion. The auroral-oval map is generally more useful for judging where activity may occur in the near term. The best viewing decision uses both.
Sources
The following sources were reviewed on August 3, 2026.
NOAA Space Weather Prediction Center — Planetary K-index
Supports the explanation of NOAA’s estimated three-hour planetary Kp, its operational uses, observatory inputs, and G-scale mapping.NOAA Space Weather Prediction Center — NOAA Space Weather Scales
Supports the G1–G5 categories, Kp thresholds, and historical geomagnetic-latitude examples.NOAA Space Weather Prediction Center — Aurora 30-Minute Forecast
Supports the OVATION forecast description, 30- to 90-minute lead-time range, viewing-distance context, and model limitations.GFZ Helmholtz Centre for Geosciences — About Kp
Supports the official three-hour Kp definition, contributing observatories, nowcast and definitive data descriptions, and international status of the index.GFZ Helmholtz Centre for Geosciences — Kp Data
Supports the distinction between current nowcast products and definitive datasets.GFZ Helmholtz Centre for Geosciences — Kp and ap Format Documentation
Supports decimal notation, three-hour intervals, data-status fields, and the Kp-to-ap comparison.GFZ Data Services — Geomagnetic Kp Index Dataset
Provides the citable official dataset and versioning record.
Editorial Method
Official definitions, Kp notation, three-hour intervals, NOAA storm categories, historical geomagnetic-latitude examples, and data-status descriptions were checked against the NOAA and GFZ sources listed above.
The following elements are original editorial tools created for this guide:
- the Reach–Timing–Sky–Signal framework;
- the viewing decision matrix;
- the observer-specific recommendations;
- the troubleshooting sequence;
- the pre-departure checklist;
- the worked middle-latitude example.
These tools are practical interpretations of published information. They are not official NOAA or GFZ models, original scientific research, proprietary aurora data, or validated prediction methods.
This guide is based on authoritative documentation and practical viewing criteria rather than a claimed program of controlled field testing. It does not promise that a particular Kp value will produce visible aurora over a particular city.
More from Aurora Forecasting & Viewing
How to Photograph the Northern Lights
Photographing the Northern Lights requires more than choosing one fixed camera setting. This practical guide explains how to select a camera and lens, focus accurately on stars, stabilize your equipment, and adjust shutter speed, aperture, and ISO according to the aurora’s brightness and movement. It includes starting settings for fast, moderate, and faint displays, along with a Motion–Brightness–Foreground framework that helps photographers make better decisions as conditions change. Readers will also learn how to use a smartphone Night mode, compose a stronger foreground, protect color-channel highlights, edit images responsibly, and disclose exposure blends clearly. A quick-reference card, three-frame comparison method, packing checklist, safety guidance, and detailed troubleshooting table make the article useful in the field. The guide relies on published guidance from NASA, NOAA, Nikon, Canon, and Apple while clearly distinguishing authoritative information from adjustable photography recommendations.
How Far South Can the Northern Lights Be Seen?
The northern lights usually remain within high-latitude regions, but powerful geomagnetic storms can carry visible aurora surprisingly far south. This guide explains why there is no single worldwide southern boundary and shows how geomagnetic latitude, the auroral oval, Kp, storm intensity, emission altitude, darkness, cloud cover, and local light pollution affect what an observer may see. It examines NOAA’s generalized U.S. visibility examples for G1 through G5 storms, while clarifying that locations such as Alabama, Florida, and southern Texas represent rare historical possibilities rather than guaranteed forecast limits. Readers will also find an original four-gate decision framework, an auditable geometric viewing-distance example, regional viewing guidance, a practical checklist, and troubleshooting advice for distinguishing faint aurora from clouds or artificial sky glow. The article helps observers decide when a forecast justifies going outside or traveling to a safer, darker viewing site.
What Are the Best Conditions for Seeing the Northern Lights?
The best Northern Lights viewing conditions occur when geomagnetic activity, clear weather, darkness, and a suitable observing location align. This guide explains why the position of the auroral oval matters more than relying on a single Kp value and shows how cloud cover, twilight, light pollution, moonlight, atmospheric transparency, and horizon visibility affect what an observer can see. It introduces the Five-Gate Aurora Viewing Framework, a practical planning tool that evaluates aurora activity, clouds, darkness, location, and available viewing time without presenting the result as a guaranteed probability. Readers will also learn how to compare short- and long-range forecasts, convert UTC forecast periods, choose a safe dark-sky site, recognize faint aurora, and troubleshoot a promising forecast that produces no visible display. The article is based on guidance from NOAA, NASA, the University of Alaska Fairbanks, and the National Park Service.
Explore More Topics
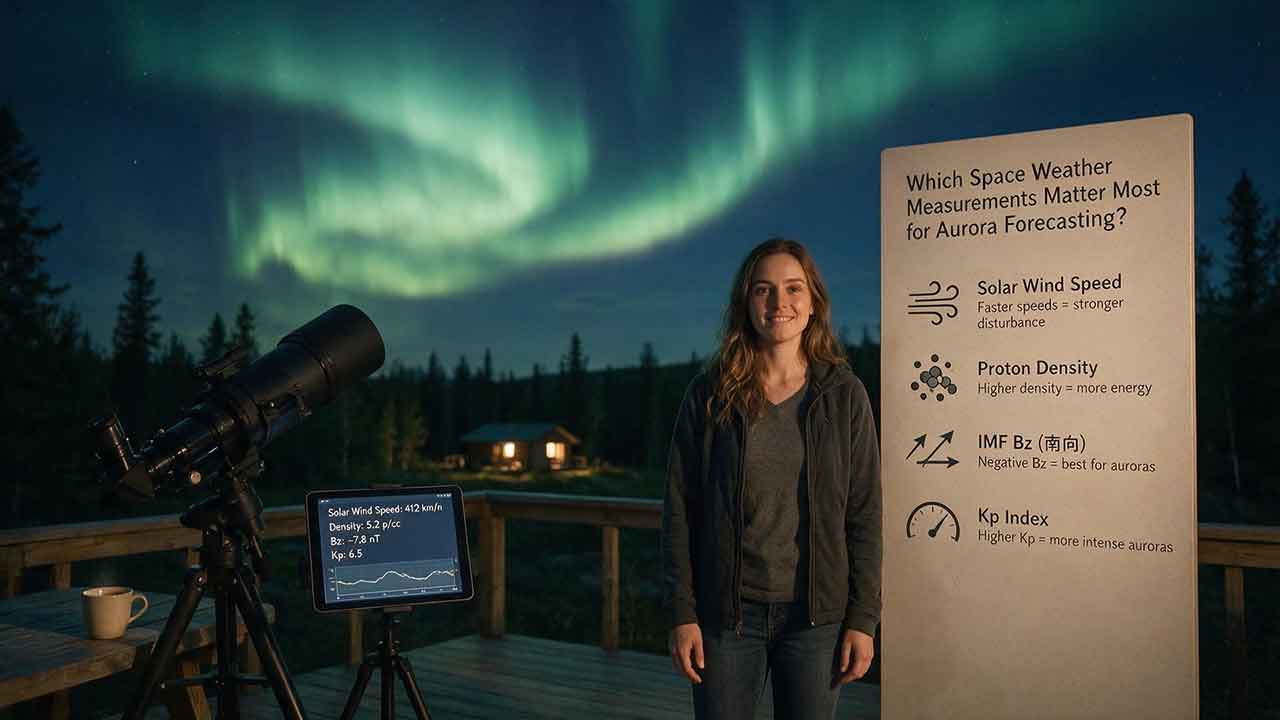
Which Space Weather Measurements Matter Most for Aurora Forecasting?
Aurora forecasting becomes more reliable when each space weather measurement is used for the right decision window. This guide explains why CME direction and propagation models matter several days ahead, while sustained southward Bz, total magnetic-field strength, solar-wind speed, density, and dynamic pressure become more useful as a disturbance approaches Earth. It also shows how Kp, auroral-oval maps, hemispheric power, AE, Dst, and local magnetometers answer different forecasting questions. Readers will learn a practical Signal–Coupling–Response–Visibility framework, compare upstream warning time with NOAA’s auroral-model guidance, work through a dynamic-pressure example, and troubleshoot conflicting forecast signals. The article also explains commonly overvalued indicators, including flare class, isolated Bz spikes, and Kp values without local-time context. Designed for aurora viewers, photographers, and travelers, it provides a clear checklist for combining official space weather data with darkness, cloud cover, road safety, and horizon visibility—without promising that any single measurement can guarantee a visible display.
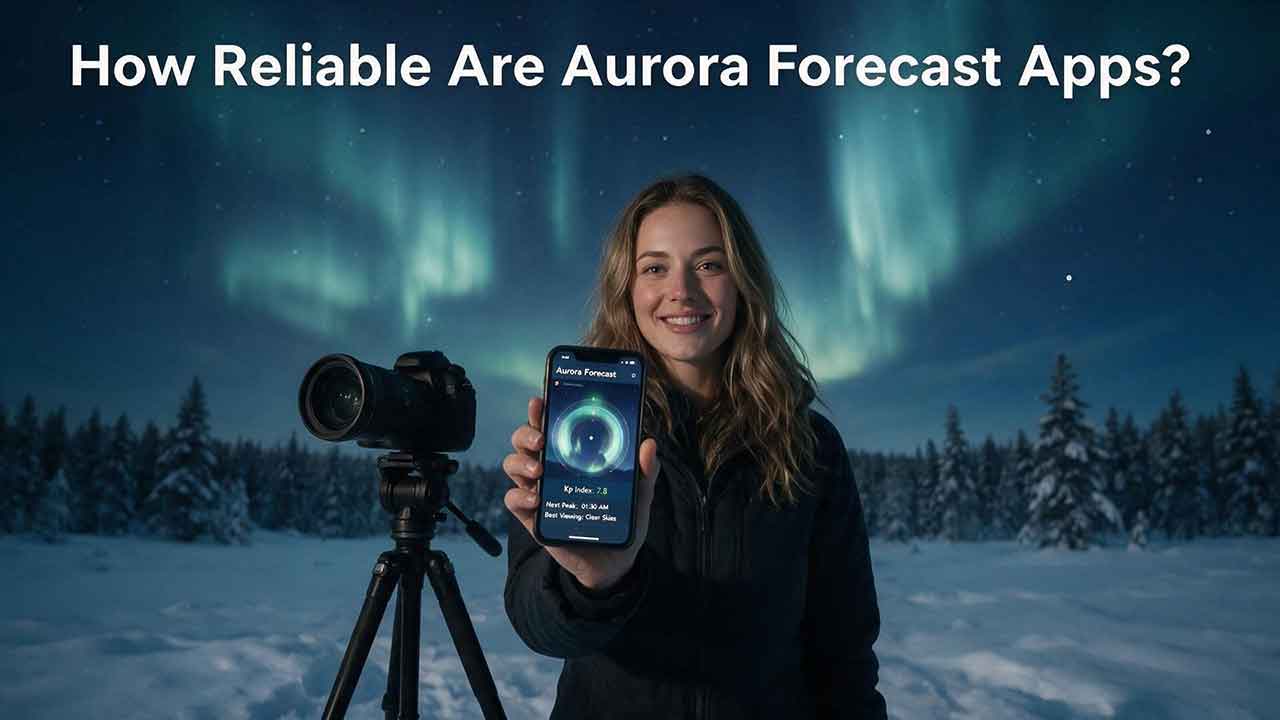
How Reliable Are Aurora Forecast Apps?
Aurora forecast apps are useful for identifying periods of elevated geomagnetic activity, but they cannot guarantee that the northern lights will be visible from a specific location at a specific time. This guide explains why app alerts sometimes disagree, how forecast reliability changes as an event approaches, and which measurements deserve the most attention. Readers will learn how to interpret the auroral oval, observed and forecast Kp, solar-wind speed, Bz, cloud cover, darkness, timestamps, and official space-weather alerts. The article also introduces the Signal-to-Sky Reliability Framework, a viewing-location comparison tool, and a transparent method for auditing app notifications without inventing accuracy claims. Practical tables, troubleshooting guidance, and a step-by-step verification process help casual observers, photographers, travelers, and lower-latitude aurora chasers decide when an alert is worth acting on. The guide is based on authoritative documentation and published research rather than hands-on commercial app rankings.
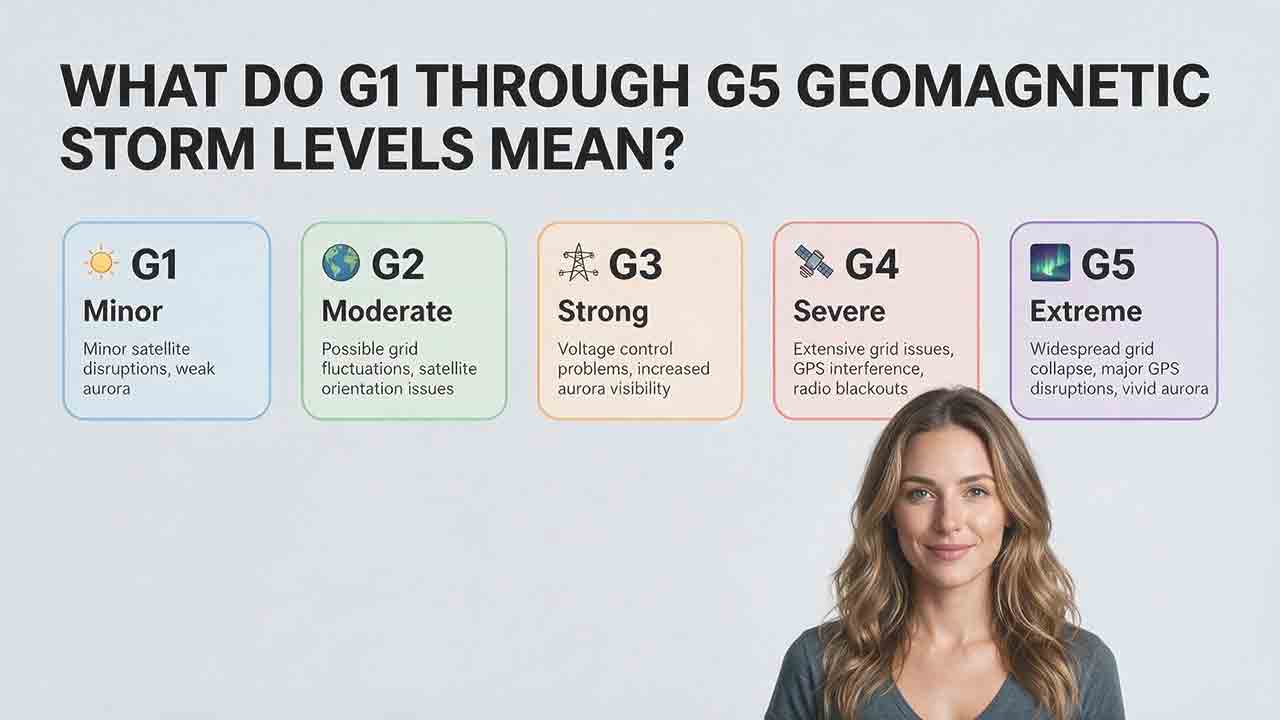
What Do G1 Through G5 Geomagnetic Storm Levels Mean?
NOAA’s G1 through G5 scale ranks geomagnetic storms from minor to extreme and translates planetary Kp measurements into practical impact categories. This guide explains the exact relationship between G levels and Kp notation, including why Kp 9− remains G4 while only Kp 9o qualifies as G5. It compares the possible effects of each level on aurora visibility, power systems, satellites, high-frequency radio, GPS, and precision navigation without treating those outcomes as guaranteed. Readers also learn how to distinguish a forecast, watch, warning, and observed alert; convert UTC forecast windows; interpret decimal Kp values such as 4.67 and 8.67; and apply the Scale–Status–Window–Location–System framework. Practical tables, a G3 watch example, common mistakes, and user-specific recommendations help the public, aurora observers, and technical users respond appropriately without unnecessary alarm.